Dubai market analytics, from off-plan projects to DLD transactions
- Off-plan projects report
- DLD transaction import
- AED per sq ft by building and community
Market transactions
What really sold, and at what price per square foot
Upload the DLD transactions PDF and Propfusion turns it into a searchable list, with the totals for whatever you filter. Use it to price a listing, or to show a seller what similar units achieved.
- Search by community or area, and by building or project
- Filter by date range, and by unit, building or land
- Sort by price or by AED per sq ft, and read the results as cards or as a table
- Each transaction
- The date, the building or community, the price in AED, the property type, the area in square feet, the AED per square foot and the sale sequence.
- Summed up for your filters
- The number of transactions, the average price, the average AED per square foot and the total value, for the community, building, property type and dates you chose.
Read the market from inside your CRM
Communities, developers, demand and pricing, drawn from the records your team already keeps.
Communities
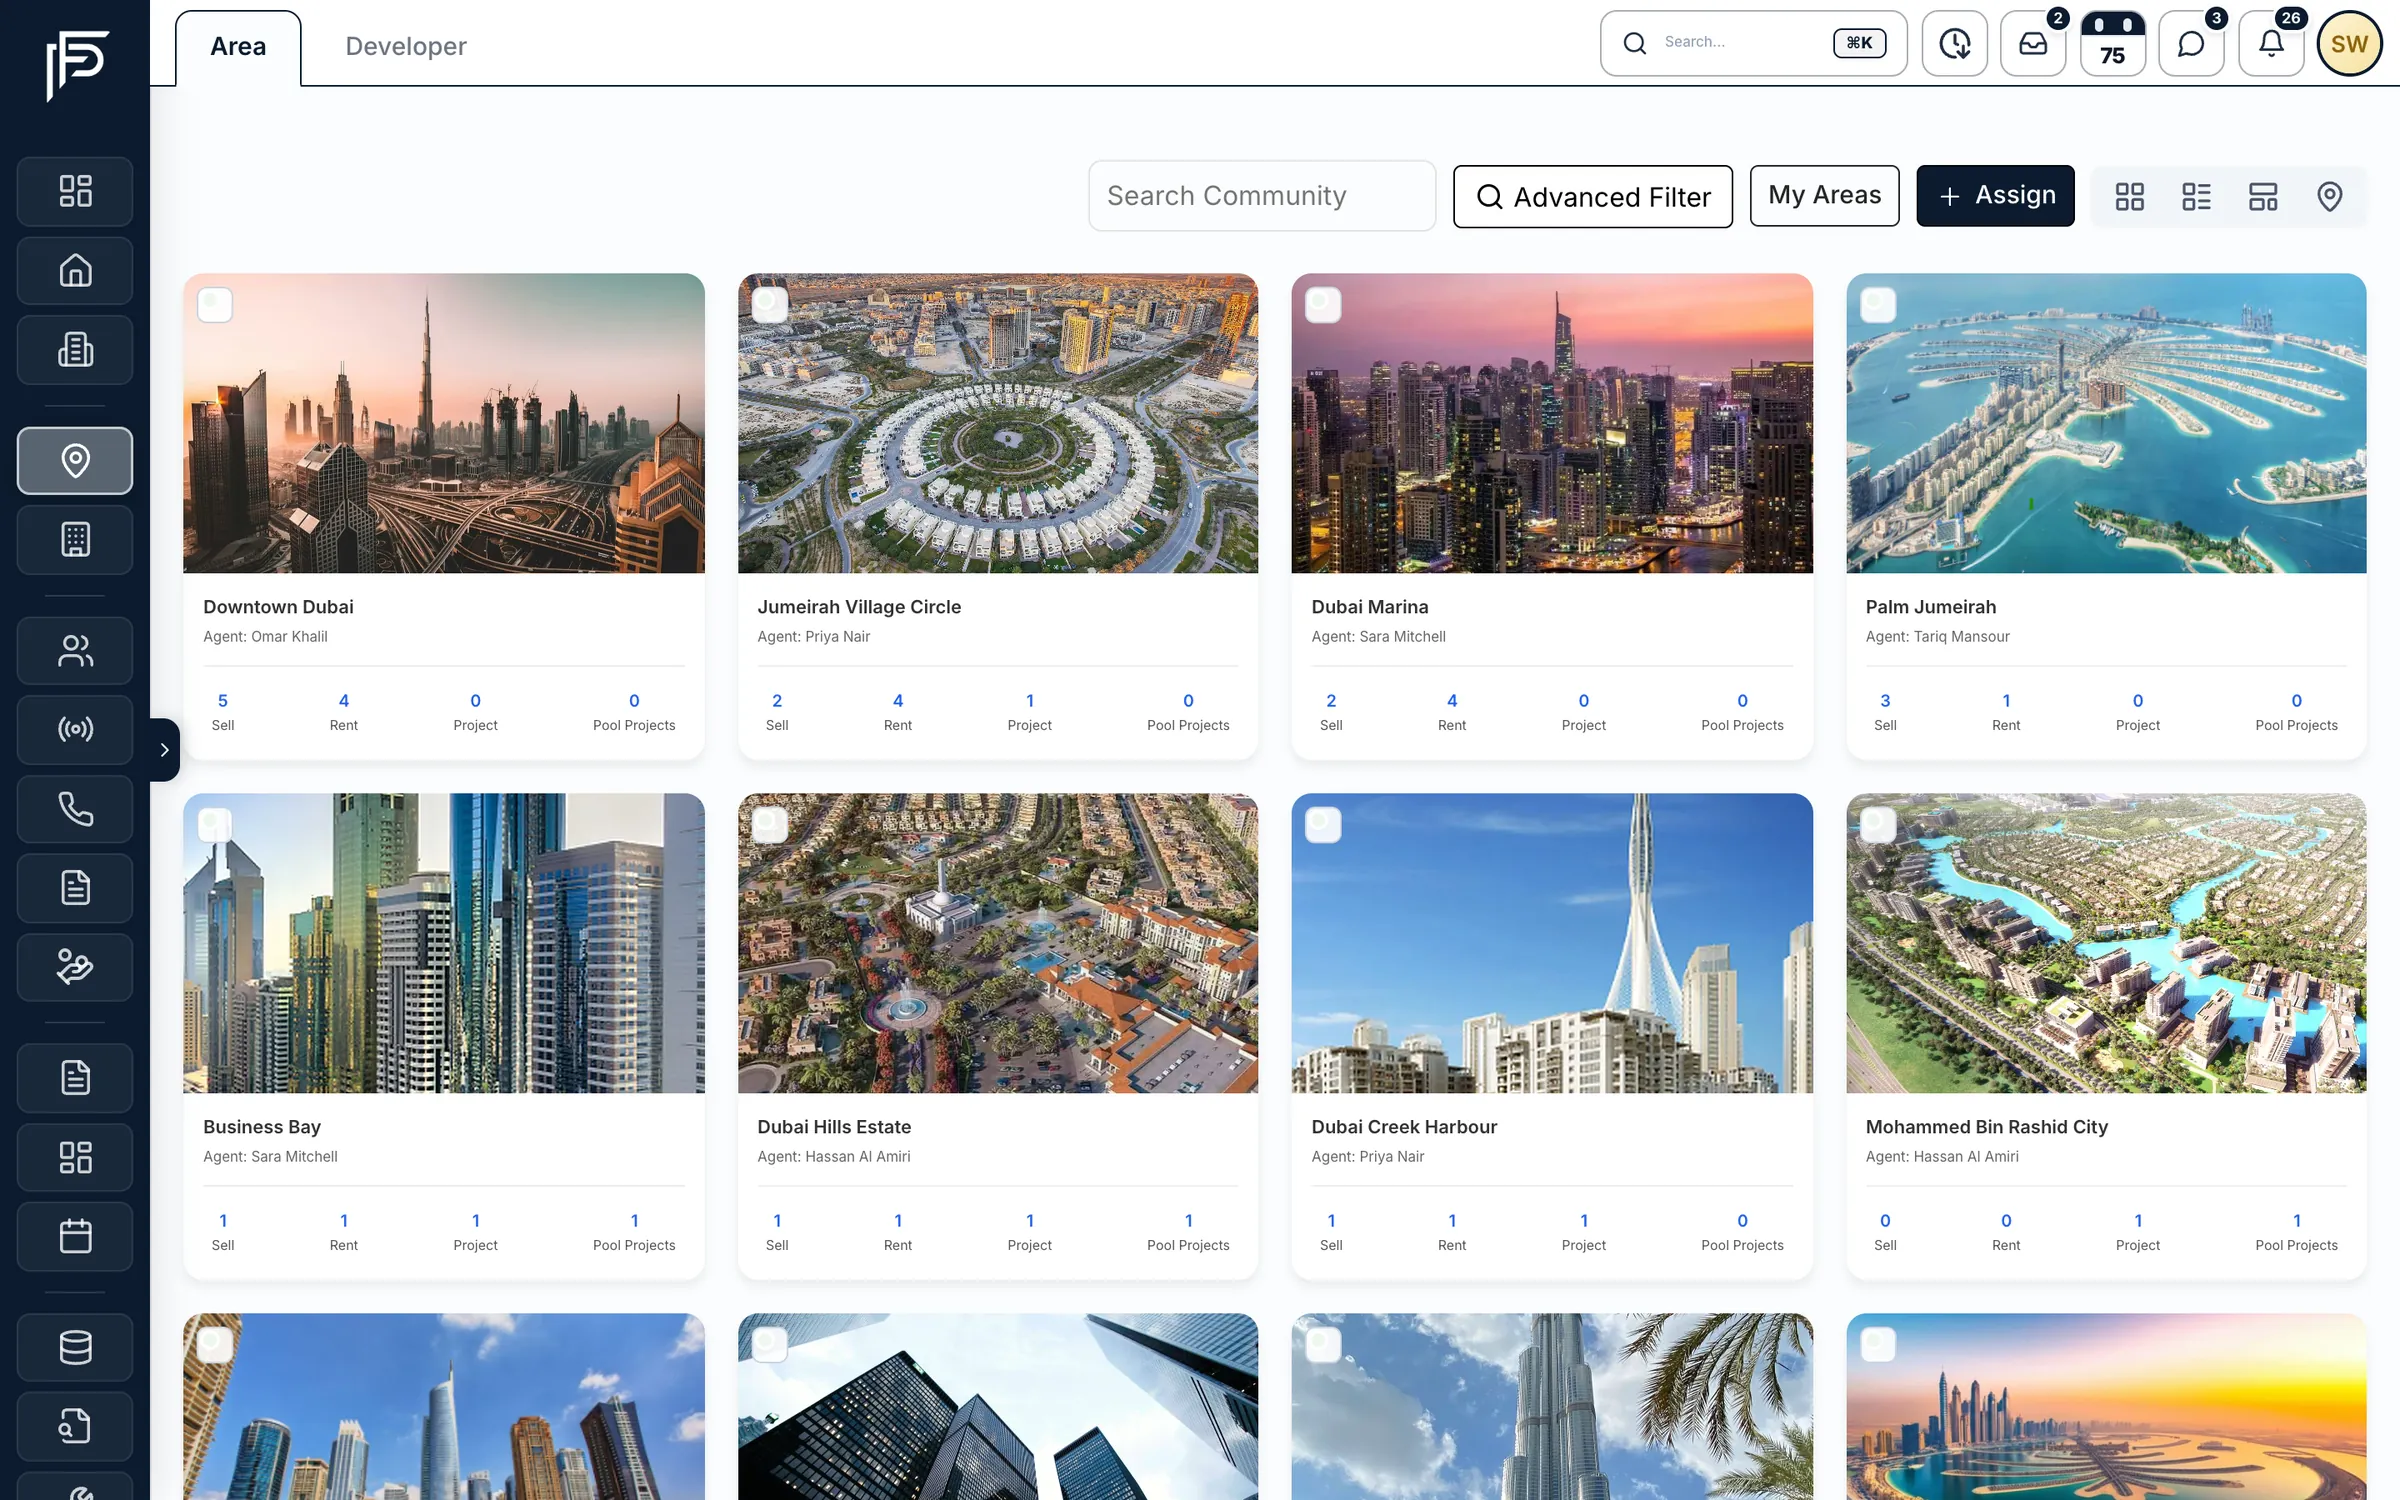
Every community, with your stock in it
- Sale, rent, project and pool project counts per community
- Grid, table, interactive and map views
- Select several communities for one combined view
Developers
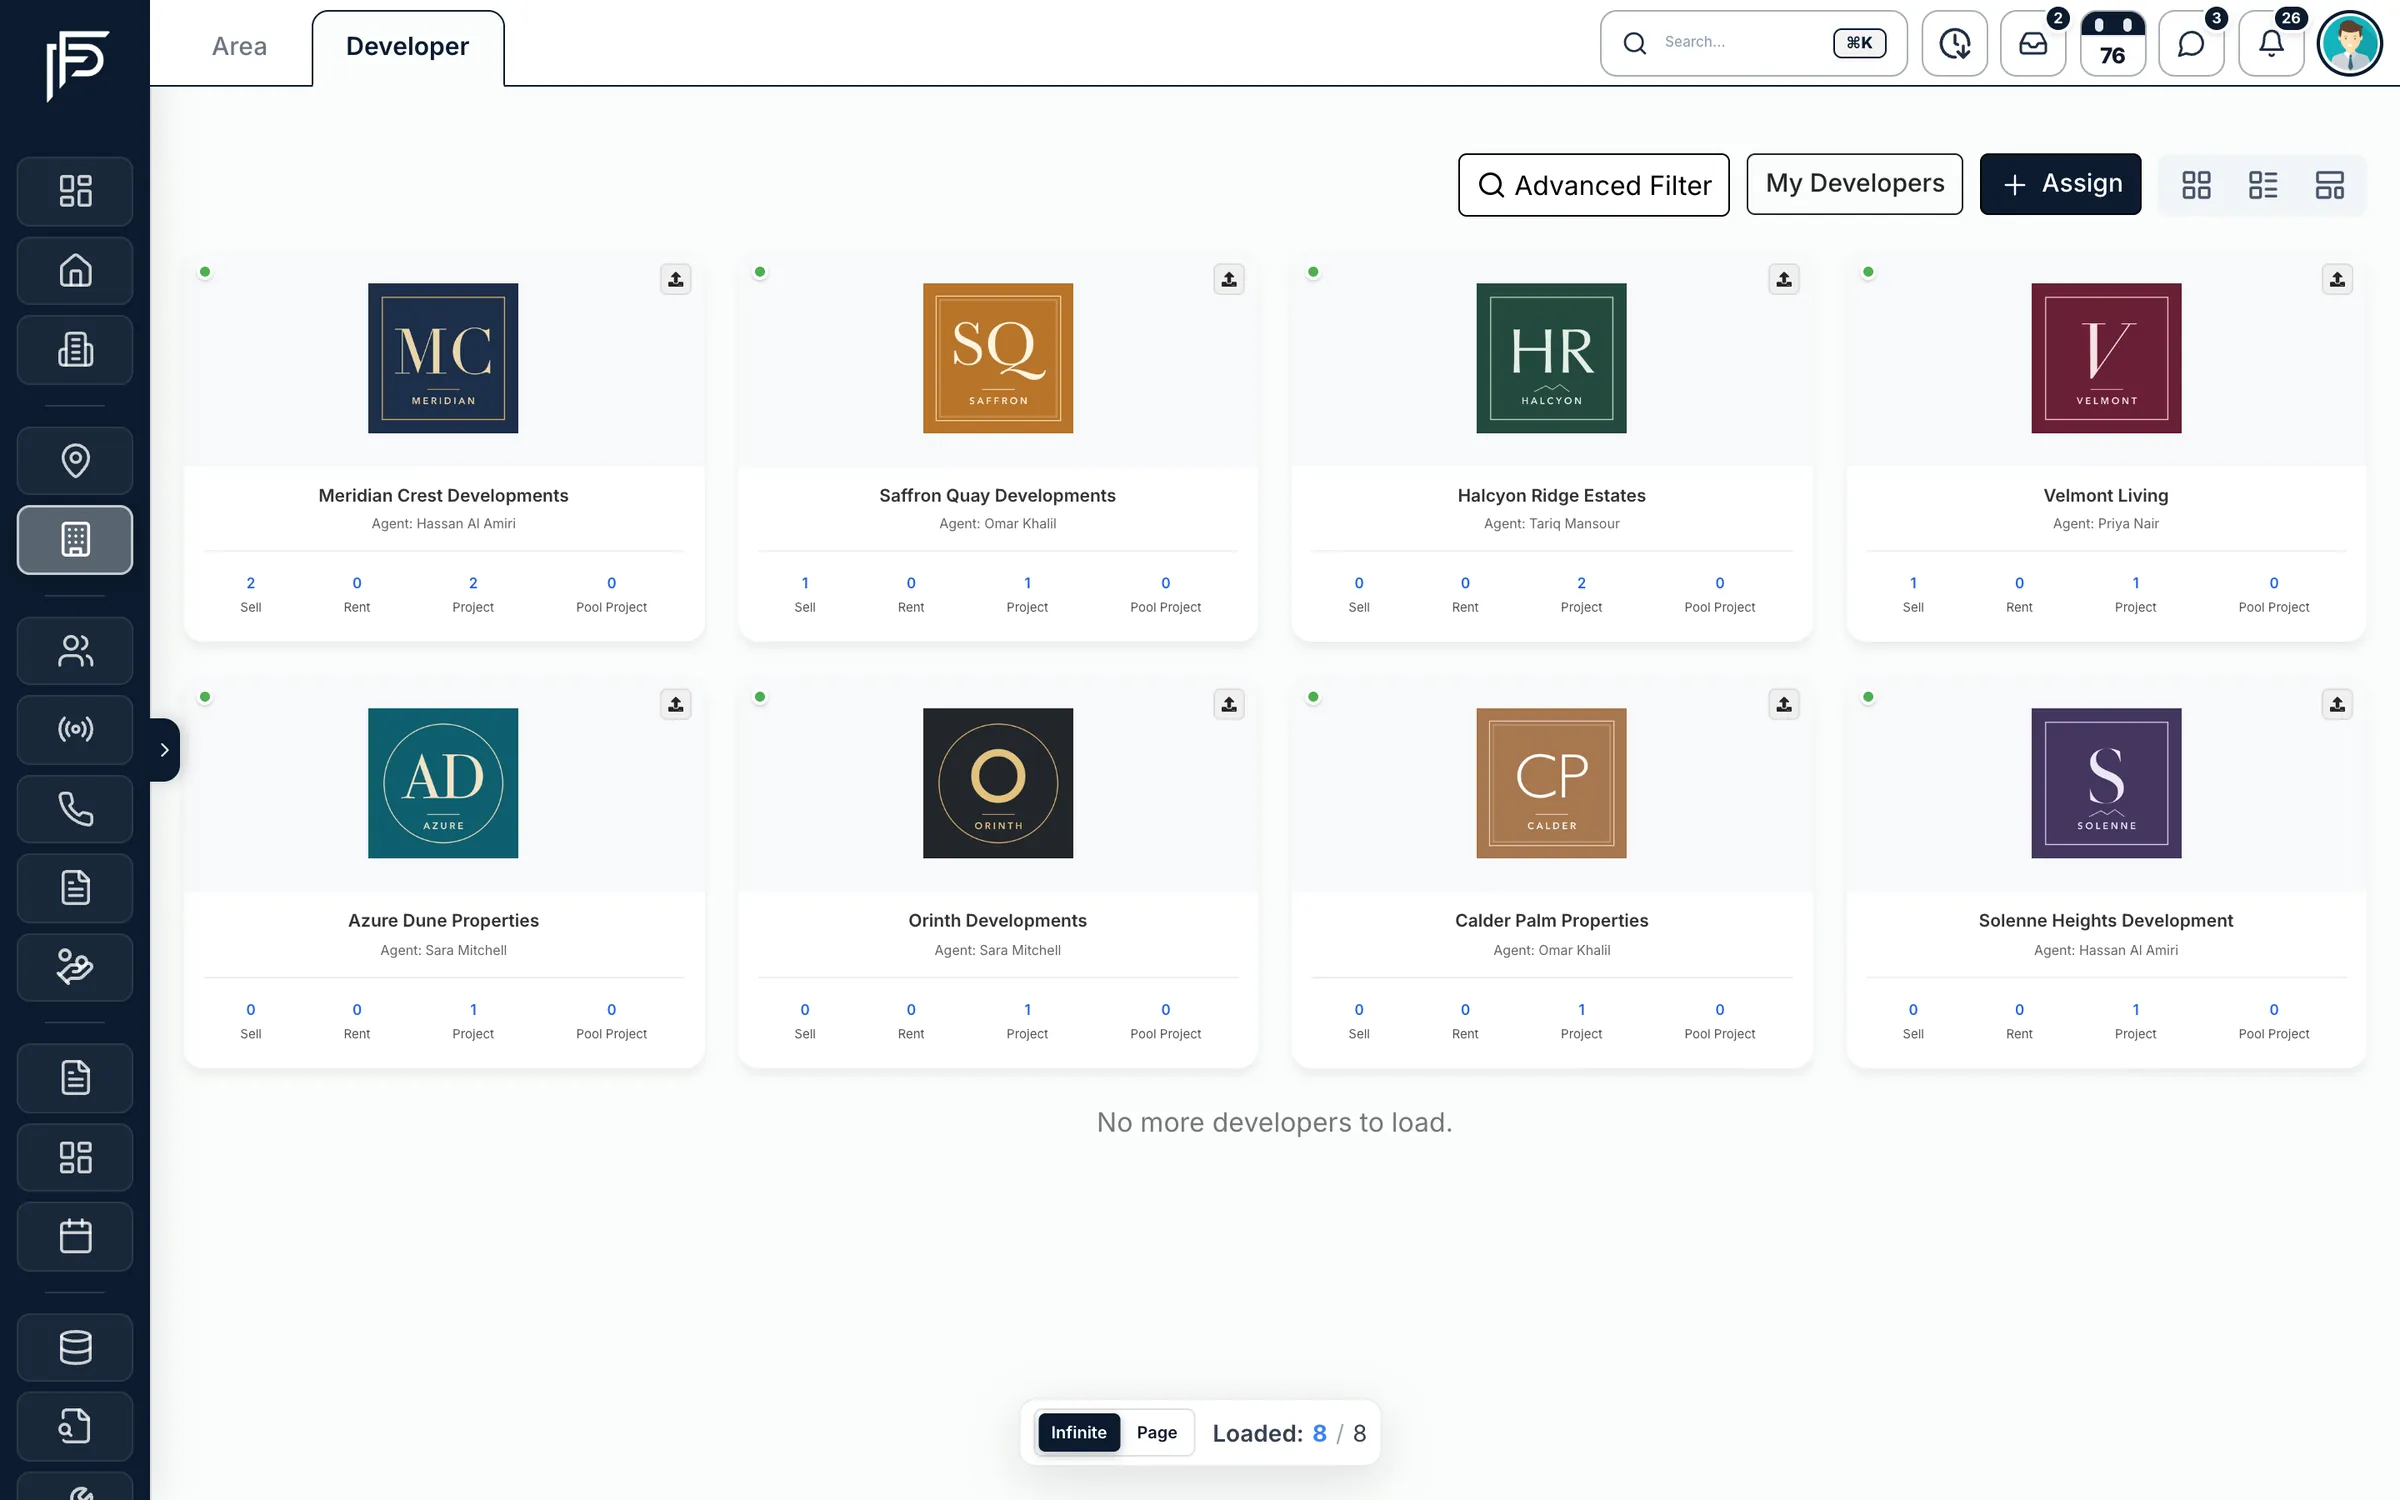
The developers you sell for, side by side
- Sale, rent, project and pool project counts per developer
- An assigned agent for each developer
- Card and list views, an advanced filter and a My Developers view
Demand
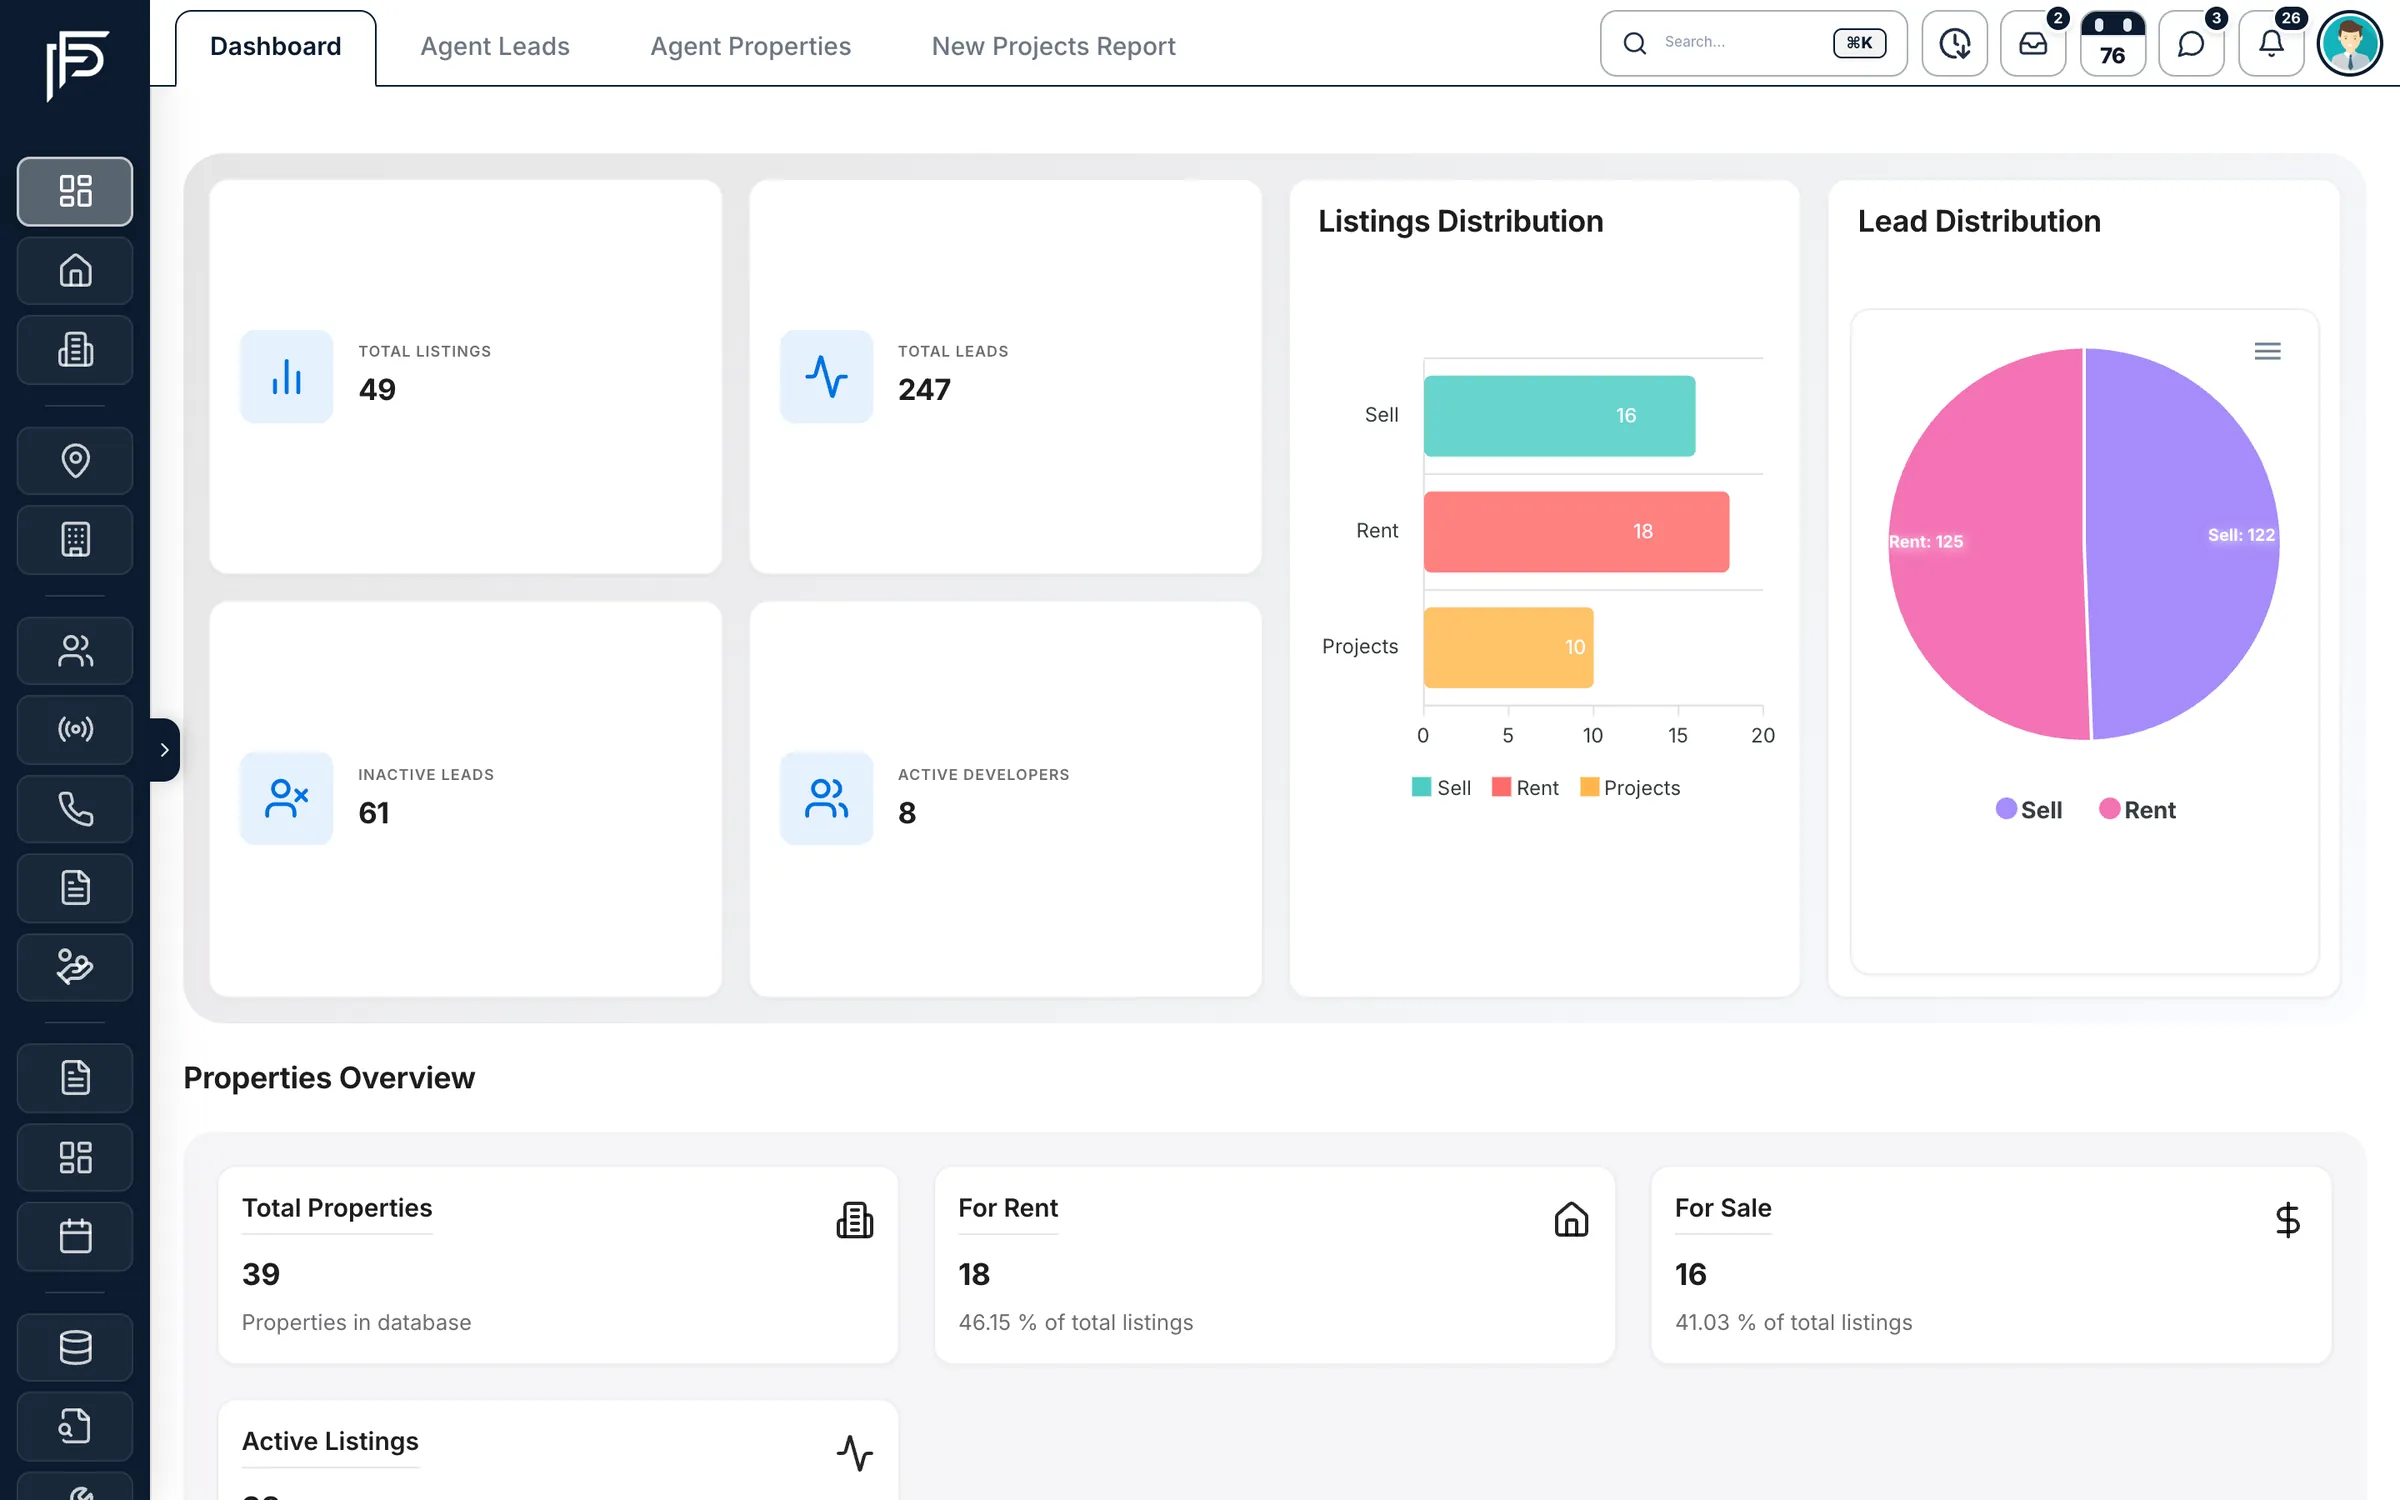
What your buyers and tenants are asking for
- Leads split between sale and rent, and by source
- Top communities in the lead reports
- Your listings by property type, price and portal
Pricing
Price per square foot on every sale listing
- AED per sq ft beside the asking price on every sale listing
- Check it against the average AED per sq ft of the imported DLD transactions for that building or community
- With Bayut connected, compare the listing's price, impressions, clicks and leads with similar listings over 7, 15 or 30 days
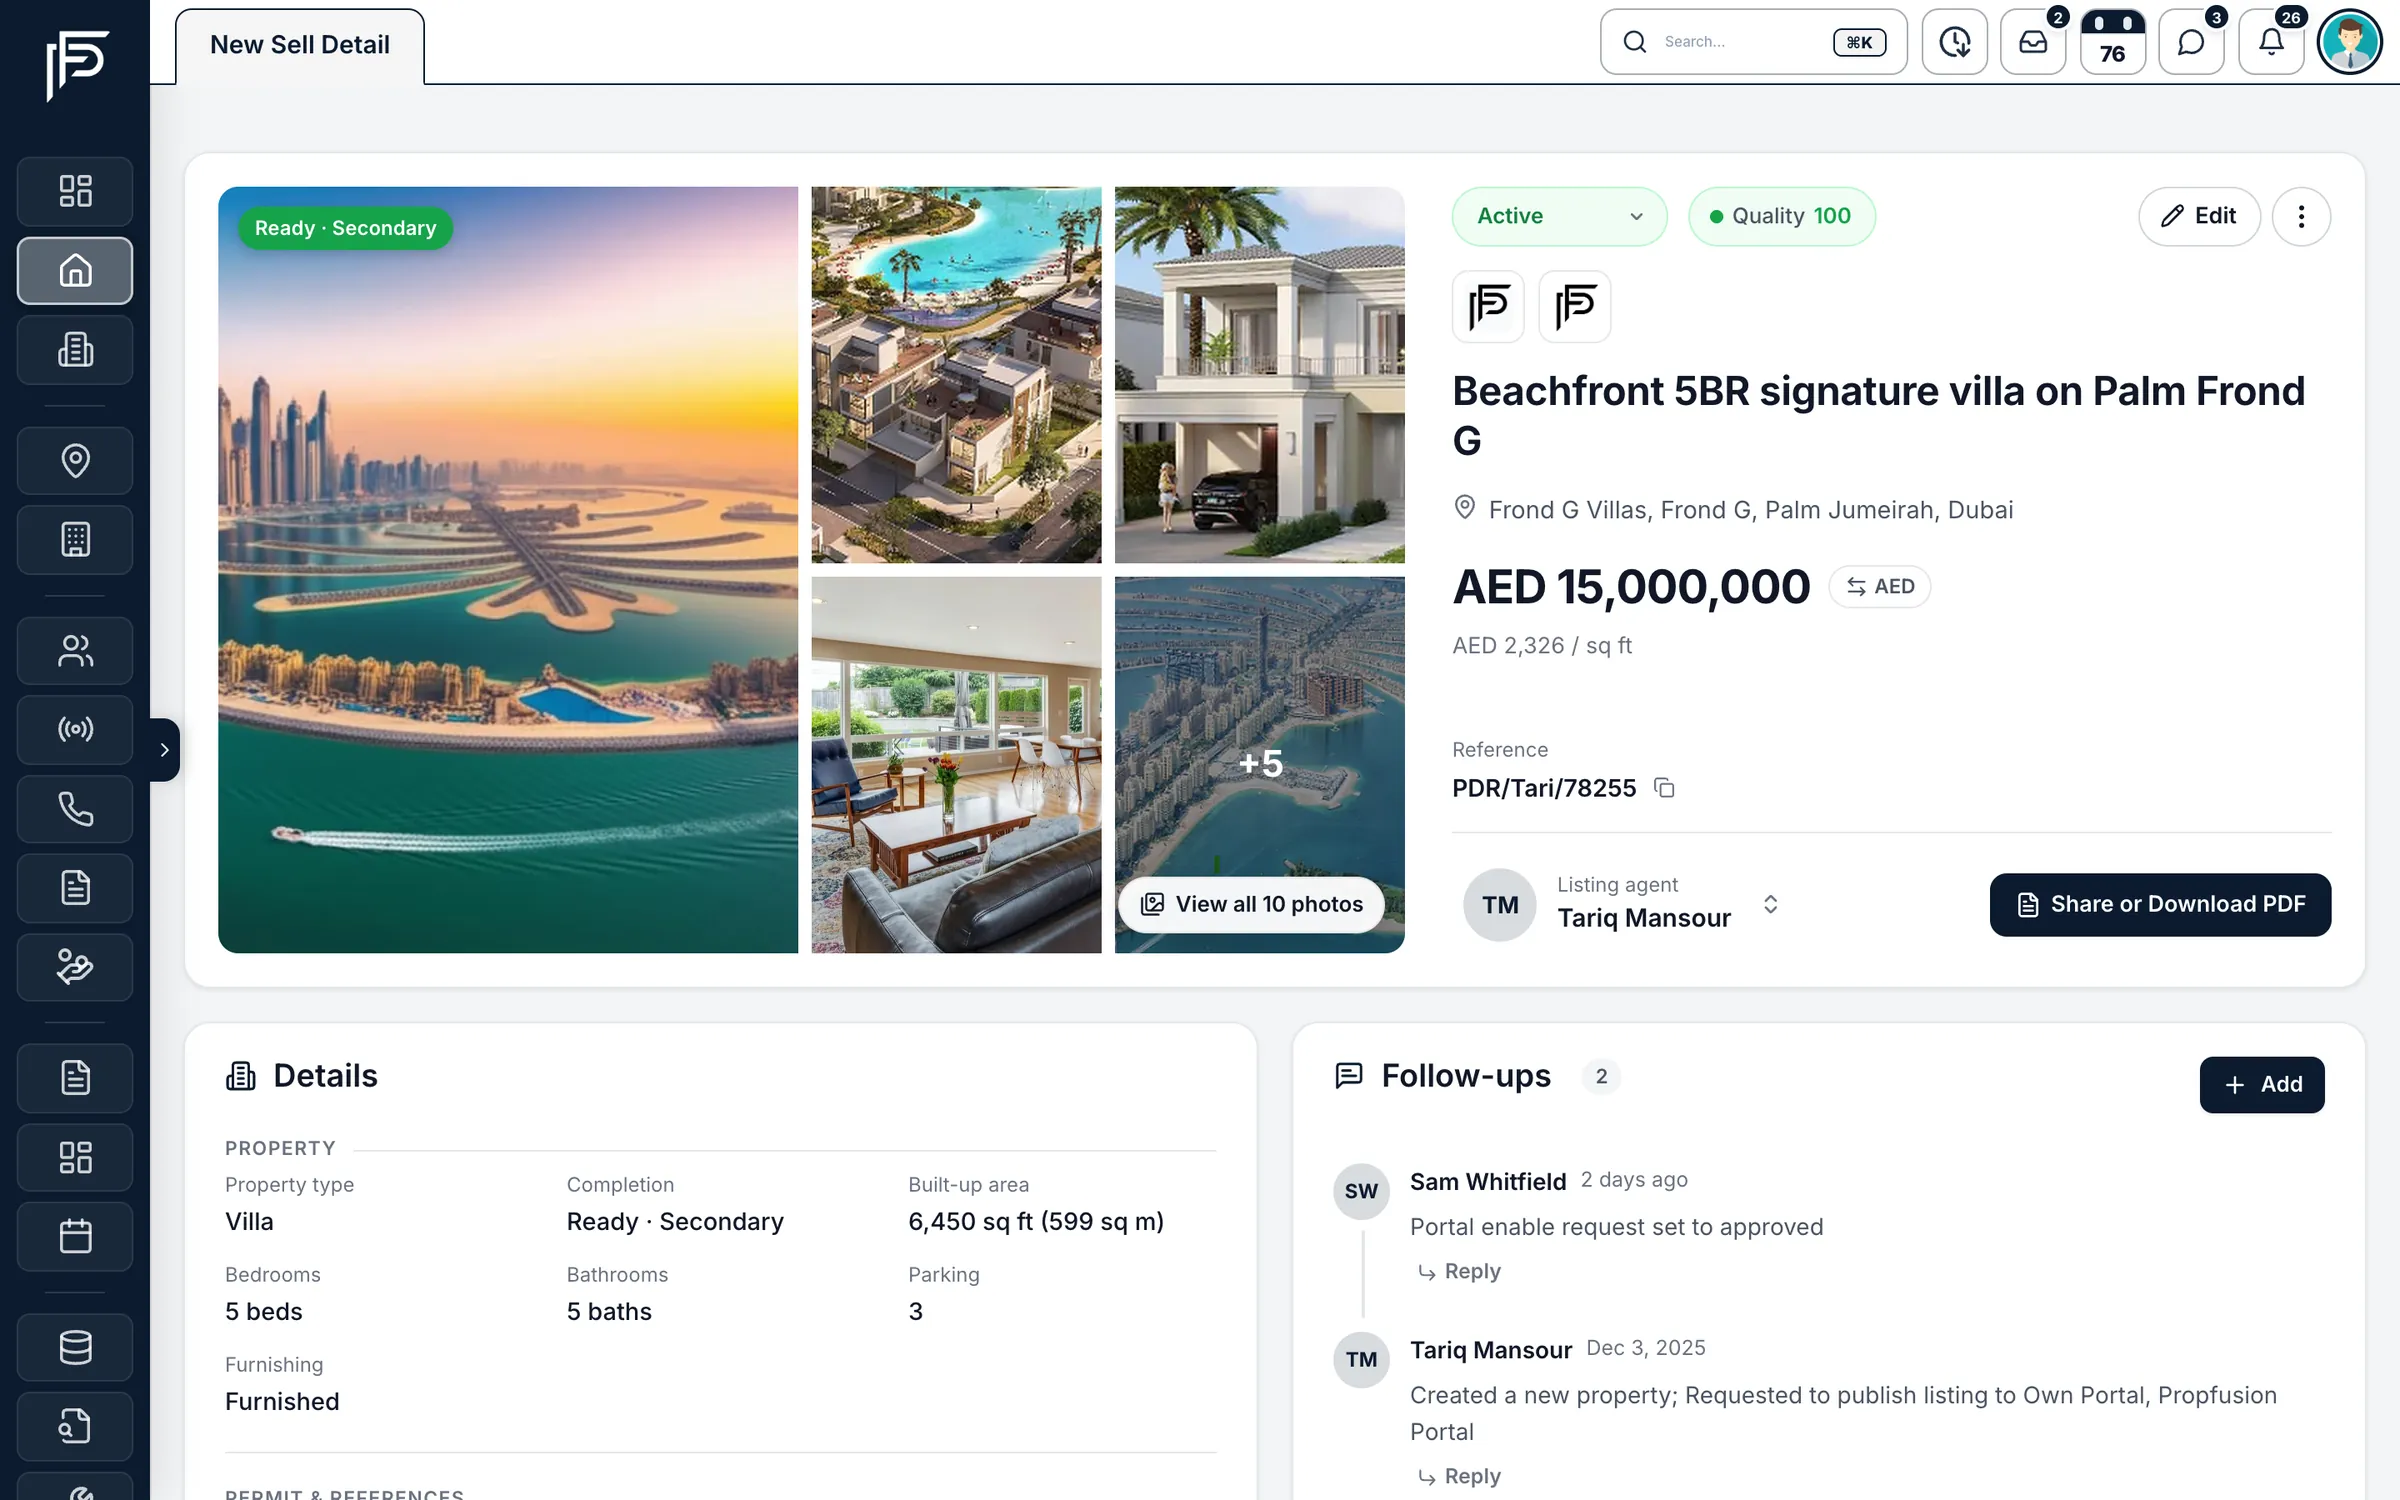
Screens show the Propfusion Demo Realty sample workspace. All people, listings and numbers are fictional.
Also included
More ways to advise with numbers
Transactions you can trust, listings priced against the market, and projects ready to present. For AI on top, see AI-powered insights
Change against the prior period
The transactions count shows, as a percentage, how it moved against the previous period of the same length.
Safe to import again
Upload a PDF that overlaps an earlier one and the transactions you already have are skipped. The import tells you how many were new.
Unclear rows flagged
Rows the PDF reader is unsure of are flagged for review, hidden until you choose to see them, and left out of the averages.
Permit check
Enter a Trakheesi permit number on a new listing and, with Property Finder connected, see what DLD holds on the property.
Payment plans on every project
Off-plan projects carry their payment plans and floor plans, ready to walk a buyer through.
Project presentations
Share an off-plan project with a client as a presentation page with its photos and a floor plan.
AI property suggestions
Each lead's profile suggests matching listings from your inventory, so the numbers turn into a shortlist.
Questions
Market analytics questions
- Where does the transaction data come from?
- From Dubai Land Department transactions PDFs. An admin with system access uploads one, and Propfusion reads it into a searchable, city-wide list with each transaction's date, building or community, price in AED, property type, area in square feet, AED per square foot and sale sequence.
- What if a new PDF overlaps one I imported before?
- The transactions you already have are skipped, and the import tells you how many were new, so it is safe to import again.
- What happens to rows the PDF reader is unsure of?
- They are flagged for review, hidden until you choose to see them, and left out of the averages, so one misread row does not skew the price per square foot.
- Can I compare a listing's price with similar listings?
- Yes, with Bayut connected. A listing's page compares its price, impressions, clicks and leads with similar listings over 7, 15 or 30 days.
- Can my own leads tell me about demand?
- Yes. The dashboard splits your leads between buying and renting, and the lead reports show which communities and property types clients ask about.
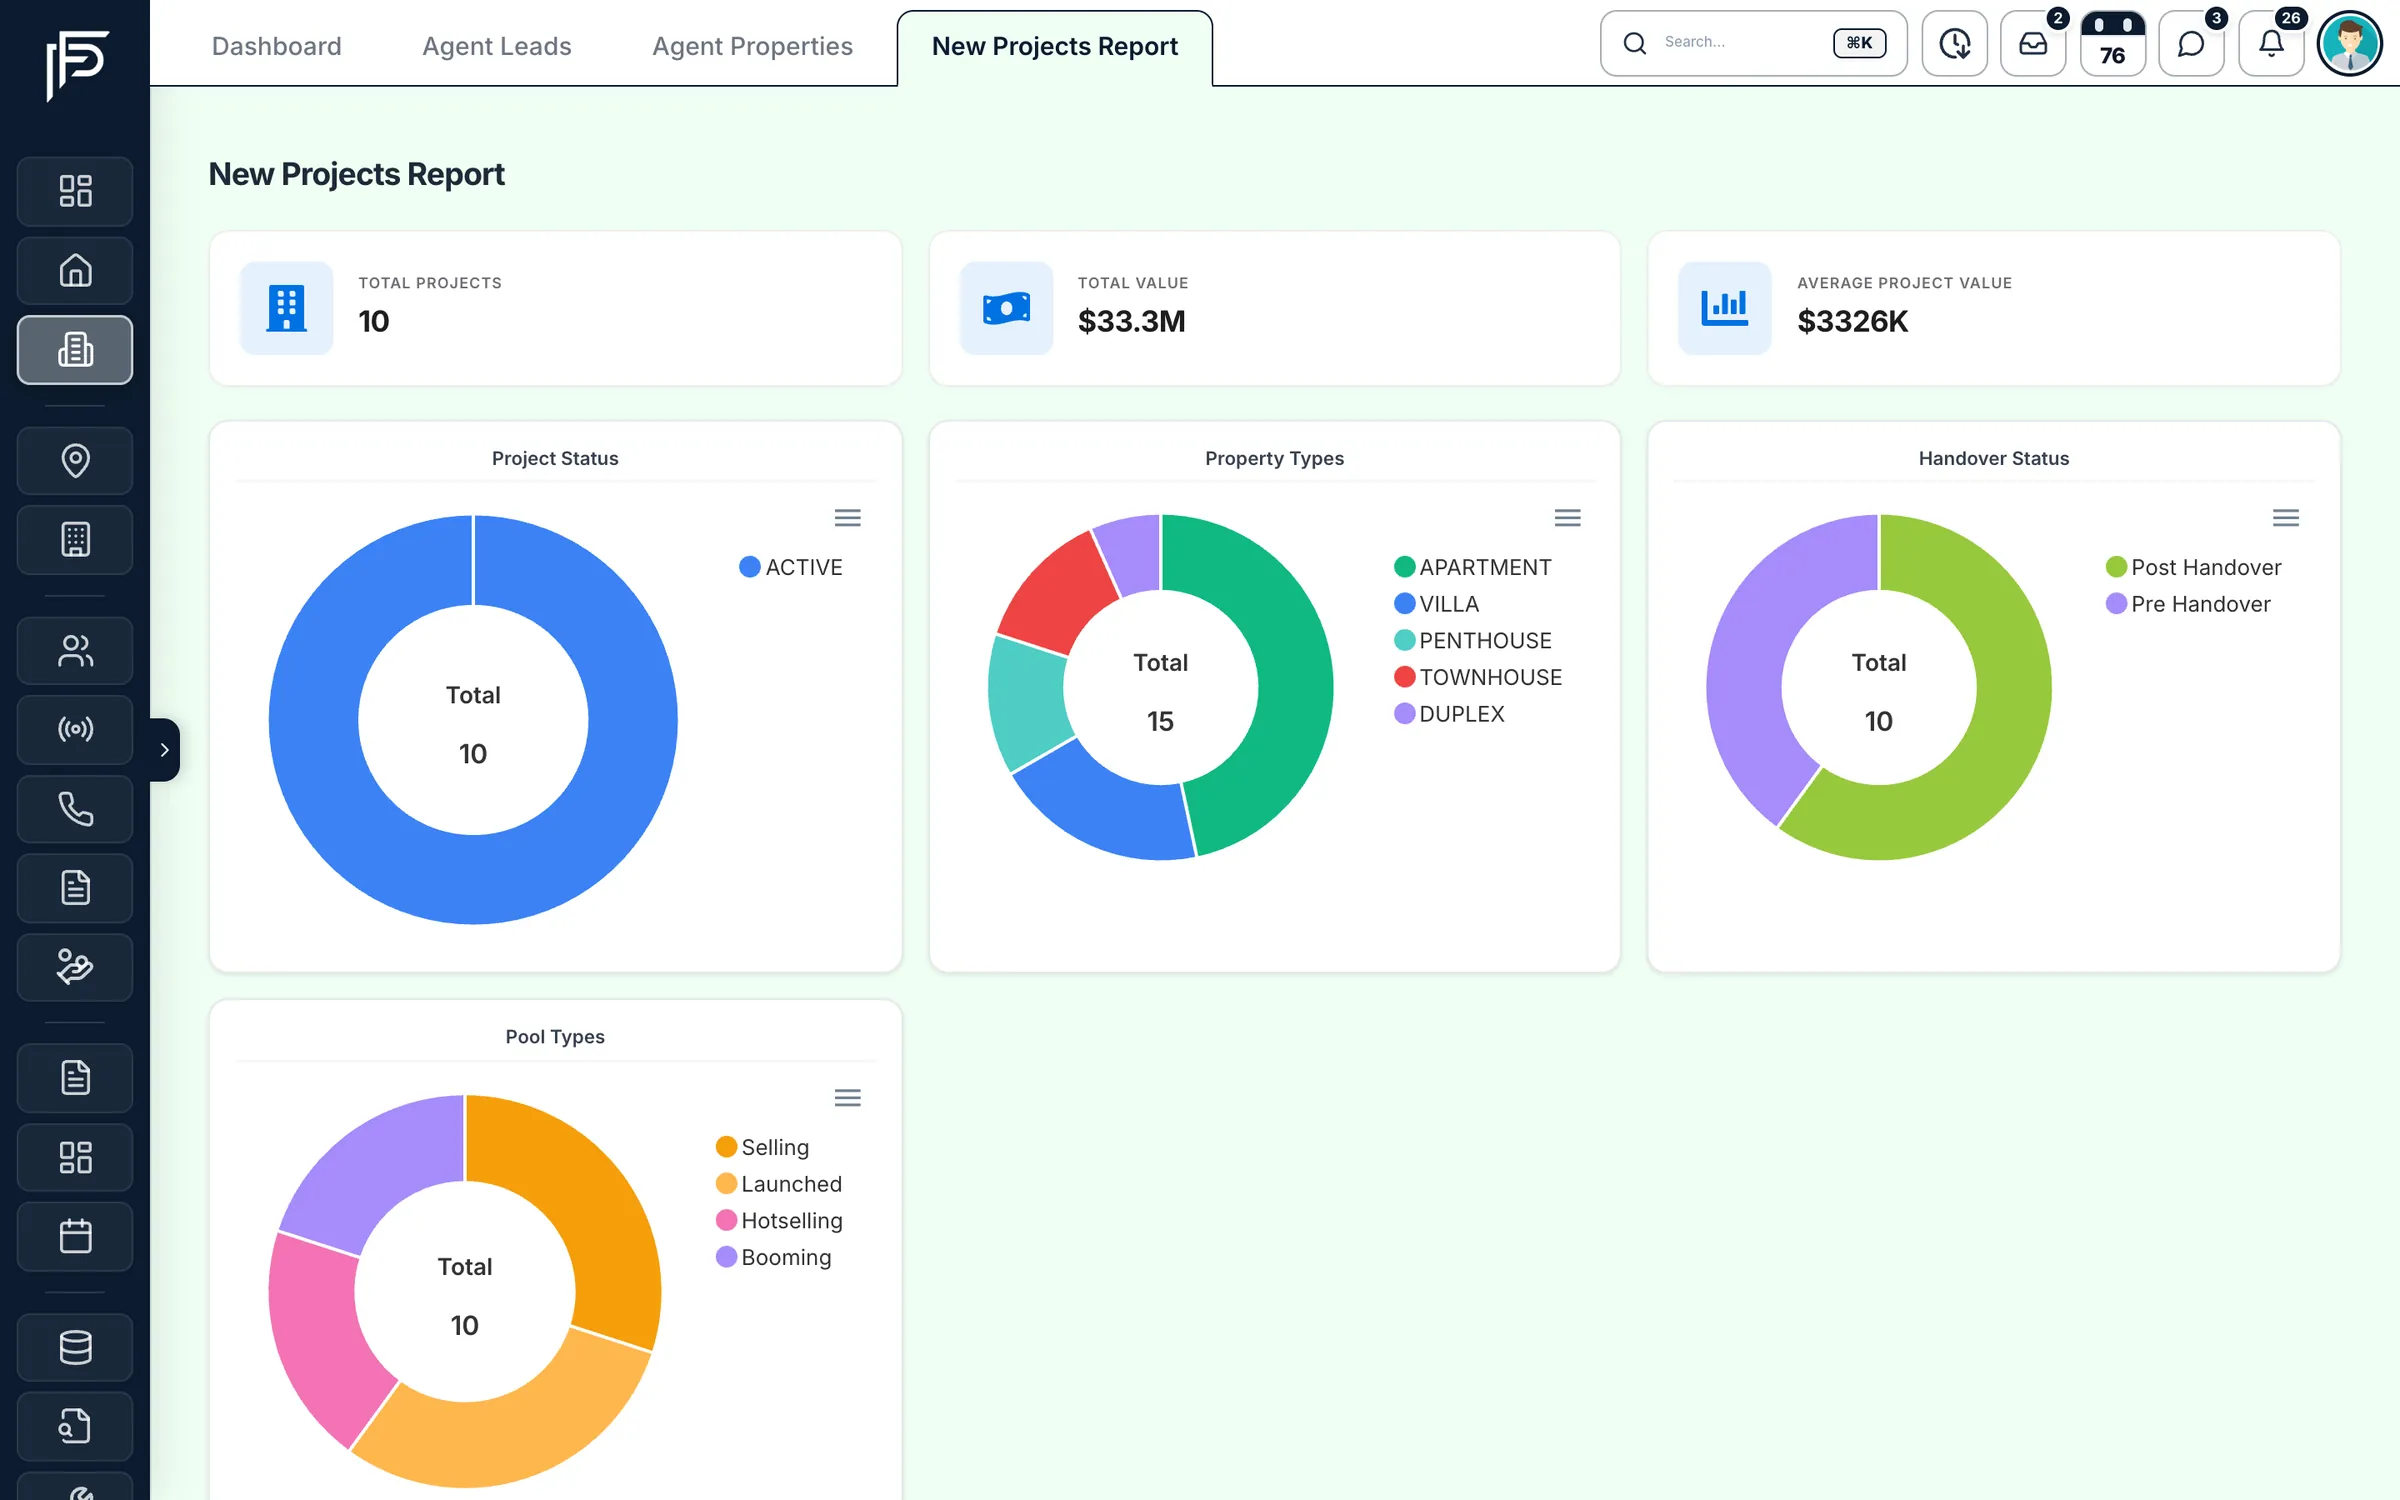
- What does the off-plan projects report show?
- How many projects you track and their total and average value, split by project status, property type, pre- or post-handover, and pool type: selling, launched, hotselling or booming.
Works hand in hand with
- Off-plan projectsProjects, payment plans and floor plans from every developer you sell for.Learn more
- Analytics and reportsDashboards and reports for leads, follow-ups, finance and staff activity.Learn more
- Interactive mapsListings, off-plan projects and communities on maps of Dubai and the UAE.Learn more