Analytics and reports
Real estate analytics and reports for your whole brokerage
One dashboard for listings, leads, follow-ups and projects, and reports for the questions managers ask each week: who is following up, what the company earned and spent, and how the team spends its day in the CRM.
7 days free · No card needed
- Live dashboard
- Finance, follow-up and activity reports
- CSV export
The dashboard
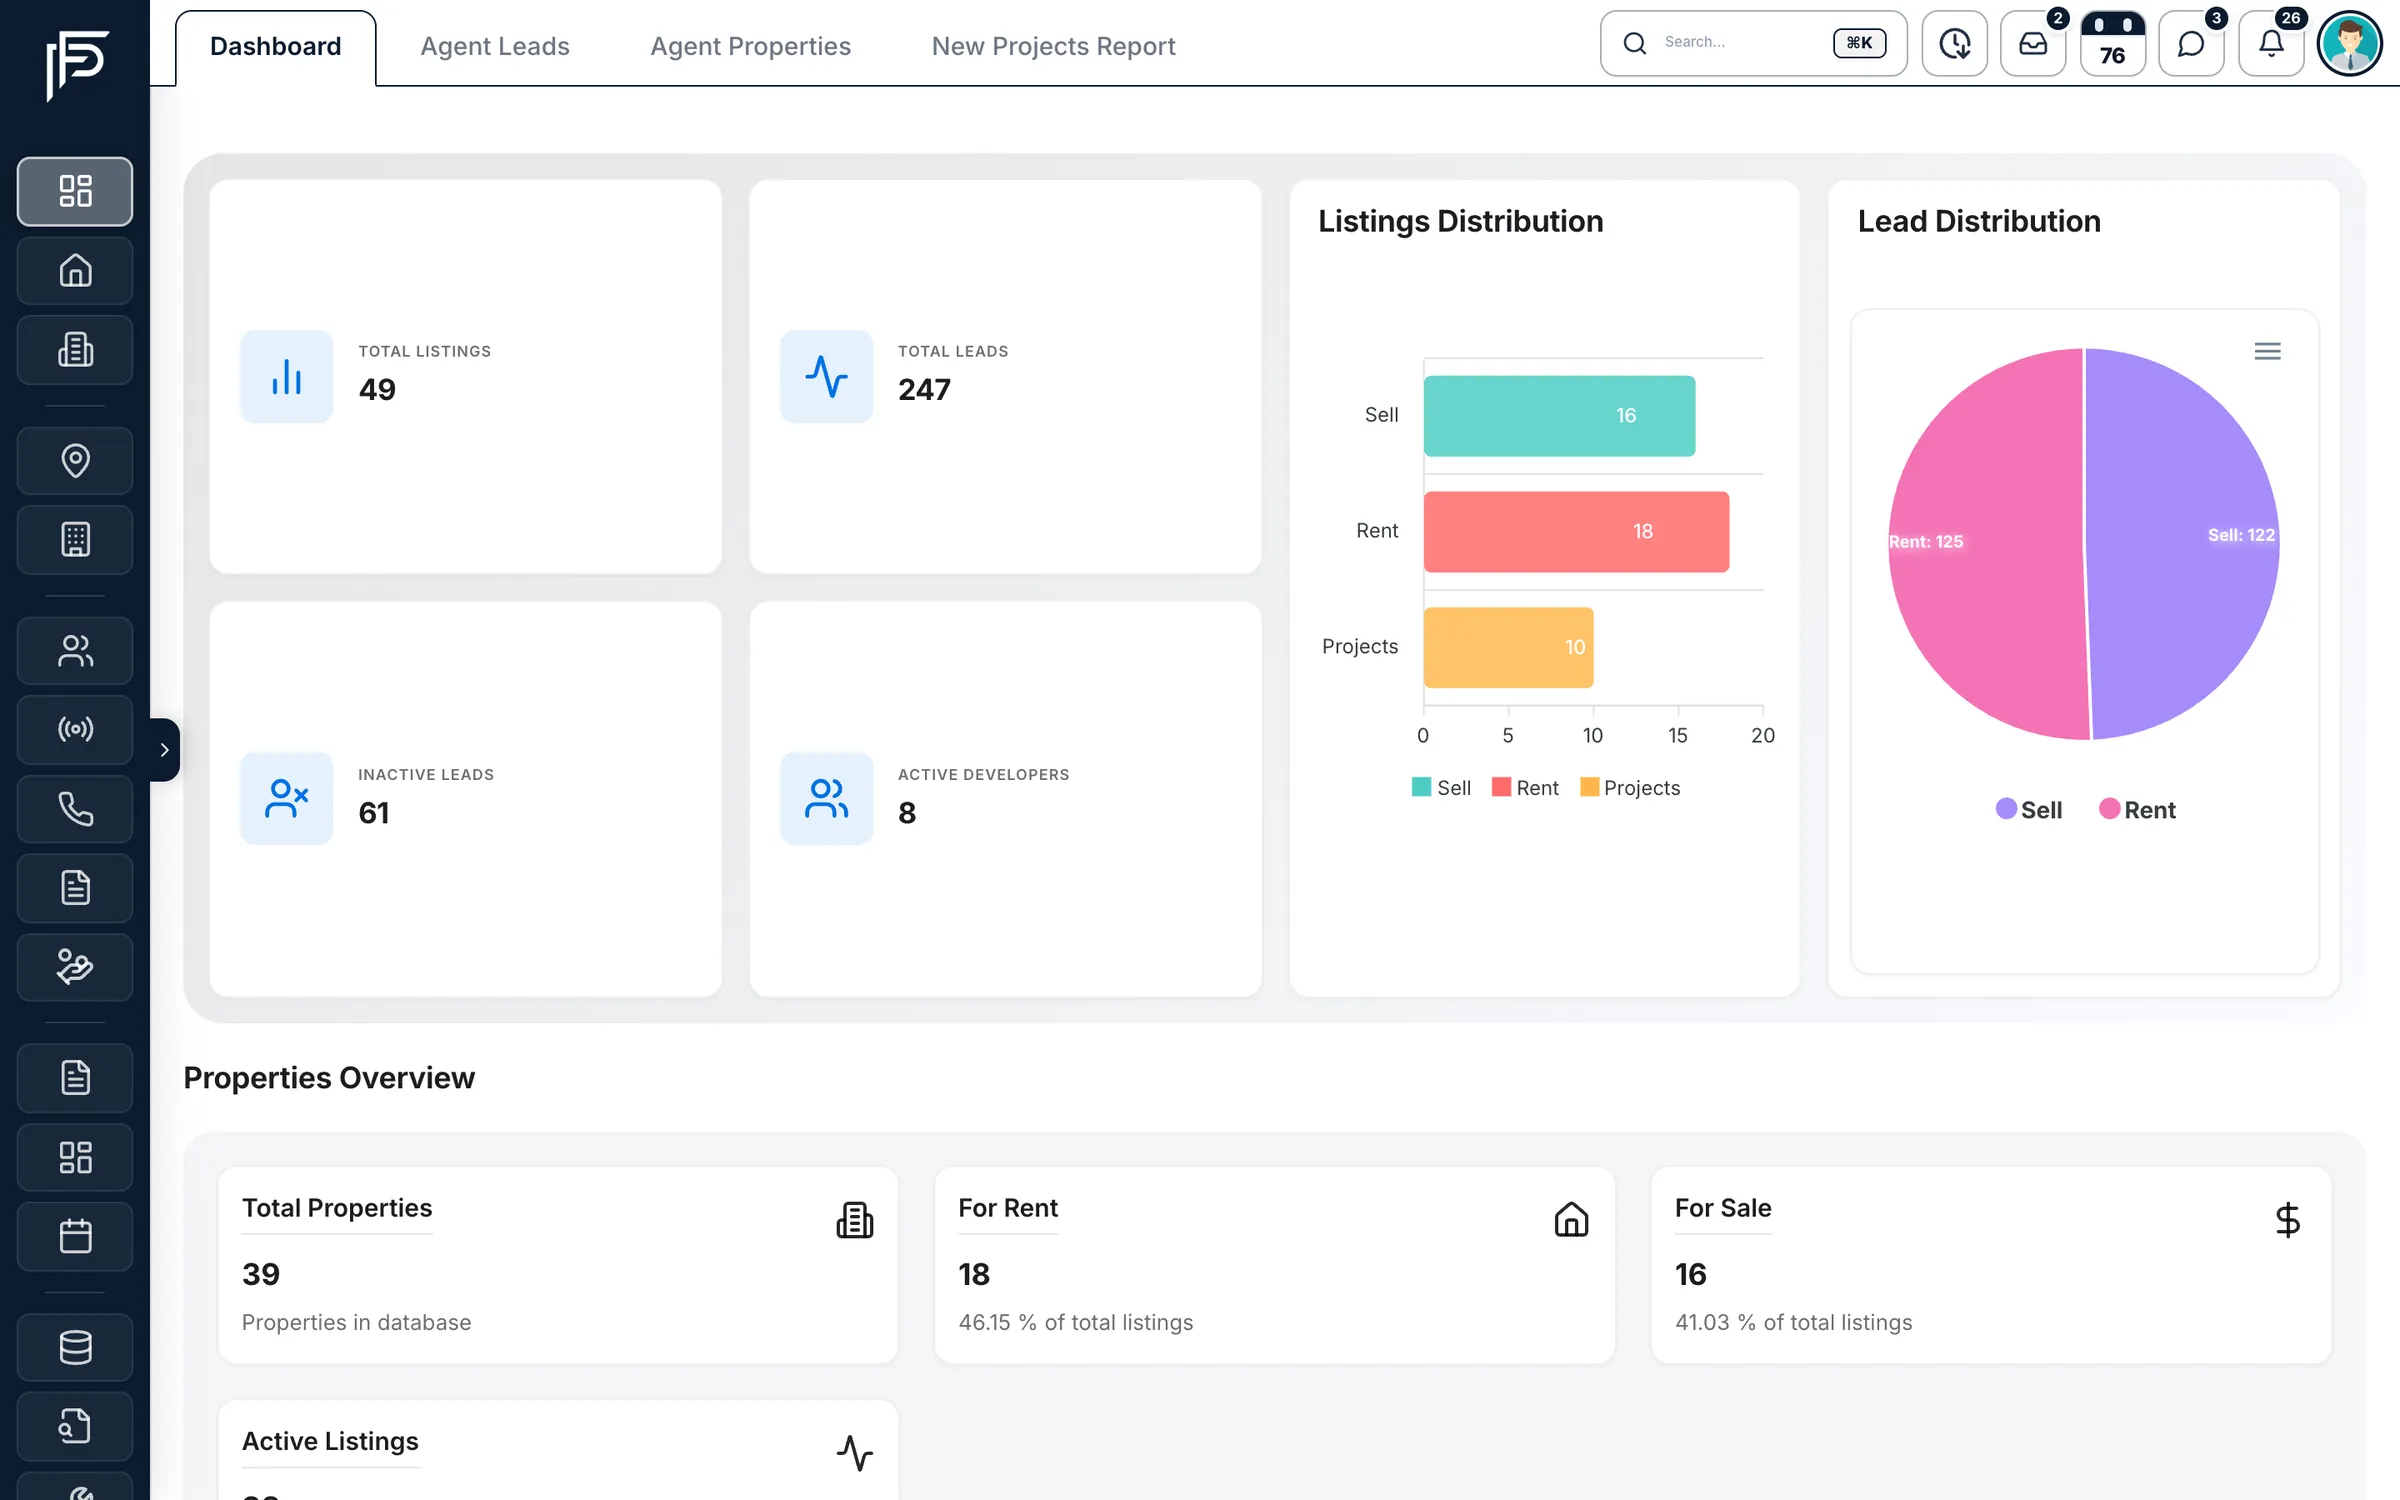
Your brokerage on one screen
The first thing you see when you sign in, kept current as your team works.
Listings
- Total listings, for sale and for rent
- Listings added per day
- Property types and price distribution
- Portal distribution
Leads
- Total and inactive leads, split between buying and renting
- Leads per day and by source
- Lead status and client type
- Top communities and top agents
Follow-ups
- Follow-ups scheduled for today
- Overdue and upcoming follow-ups
- Leads in each pipeline stage
Projects
- Active developers
- Projects next to sale and rent listings
- Off-plan projects on a map
Reports for the questions managers ask
Finance, follow-ups, activity and trends, each one a click from the dashboard.
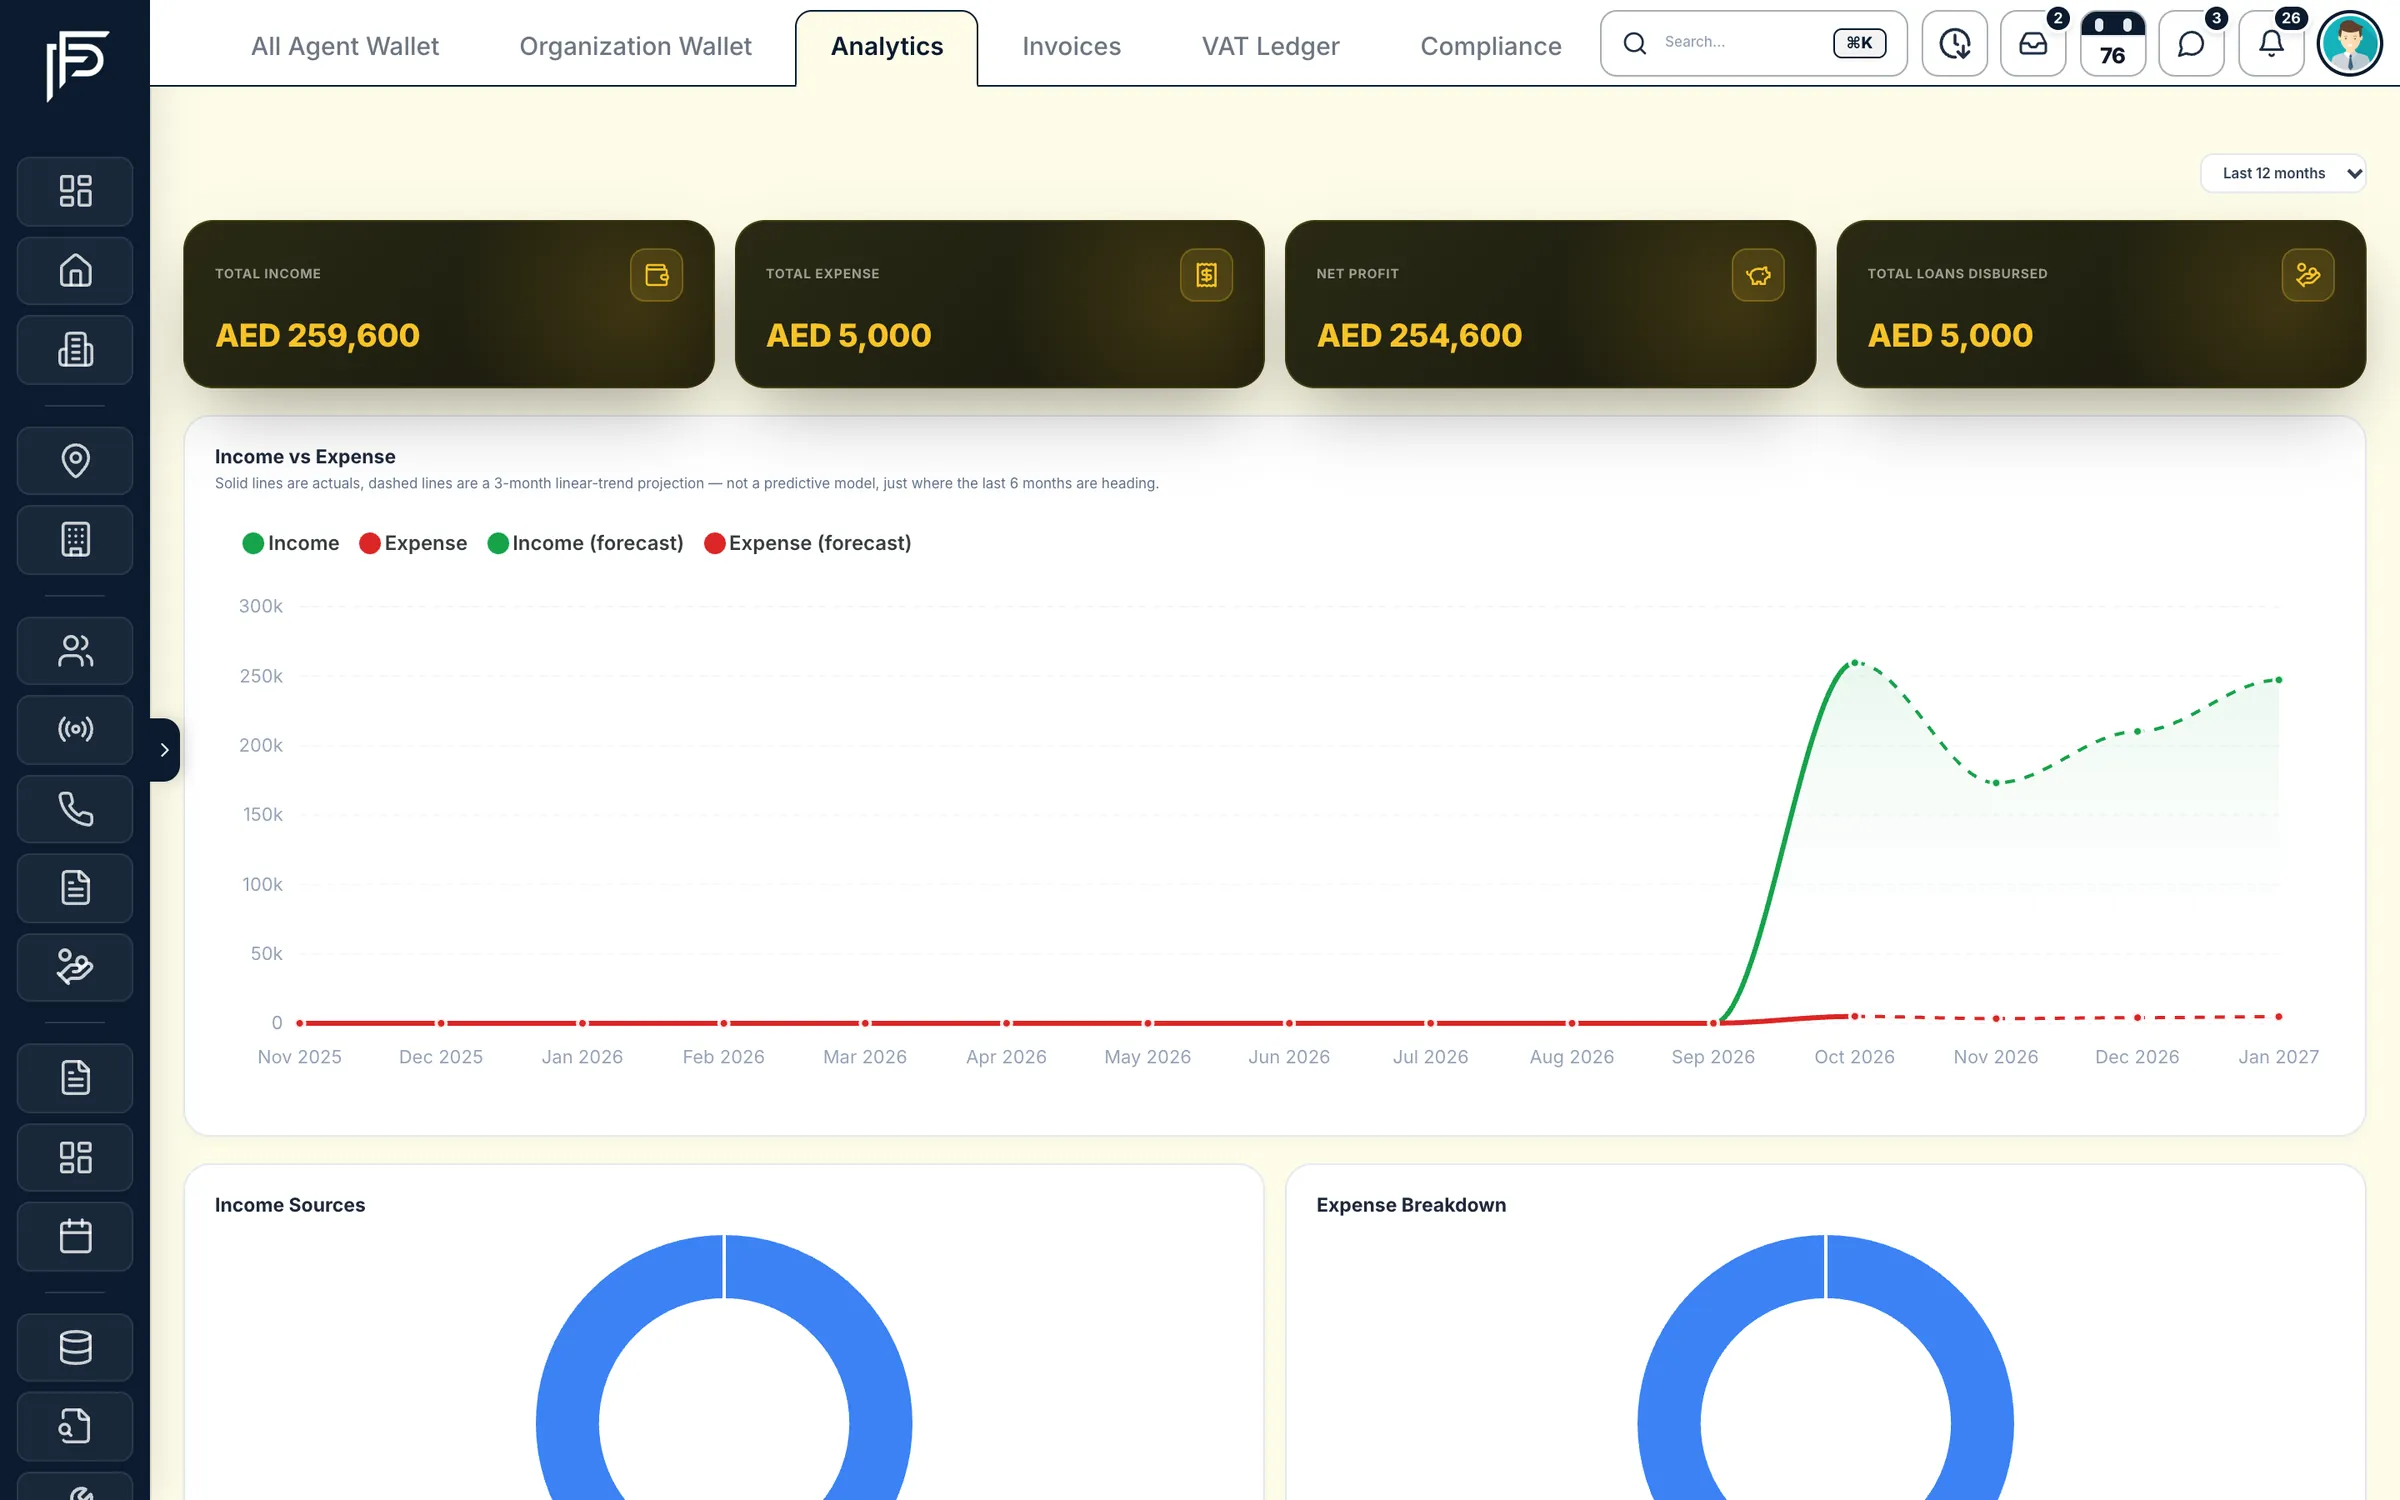
Financial analytics
Income, expenses and profit, with an honest forecast
- Income sources and expense breakdown charts
- Compare agents on income, expenses or loans, one line per agent
- Each agent's average monthly earnings and next month's estimate
Follow-up report
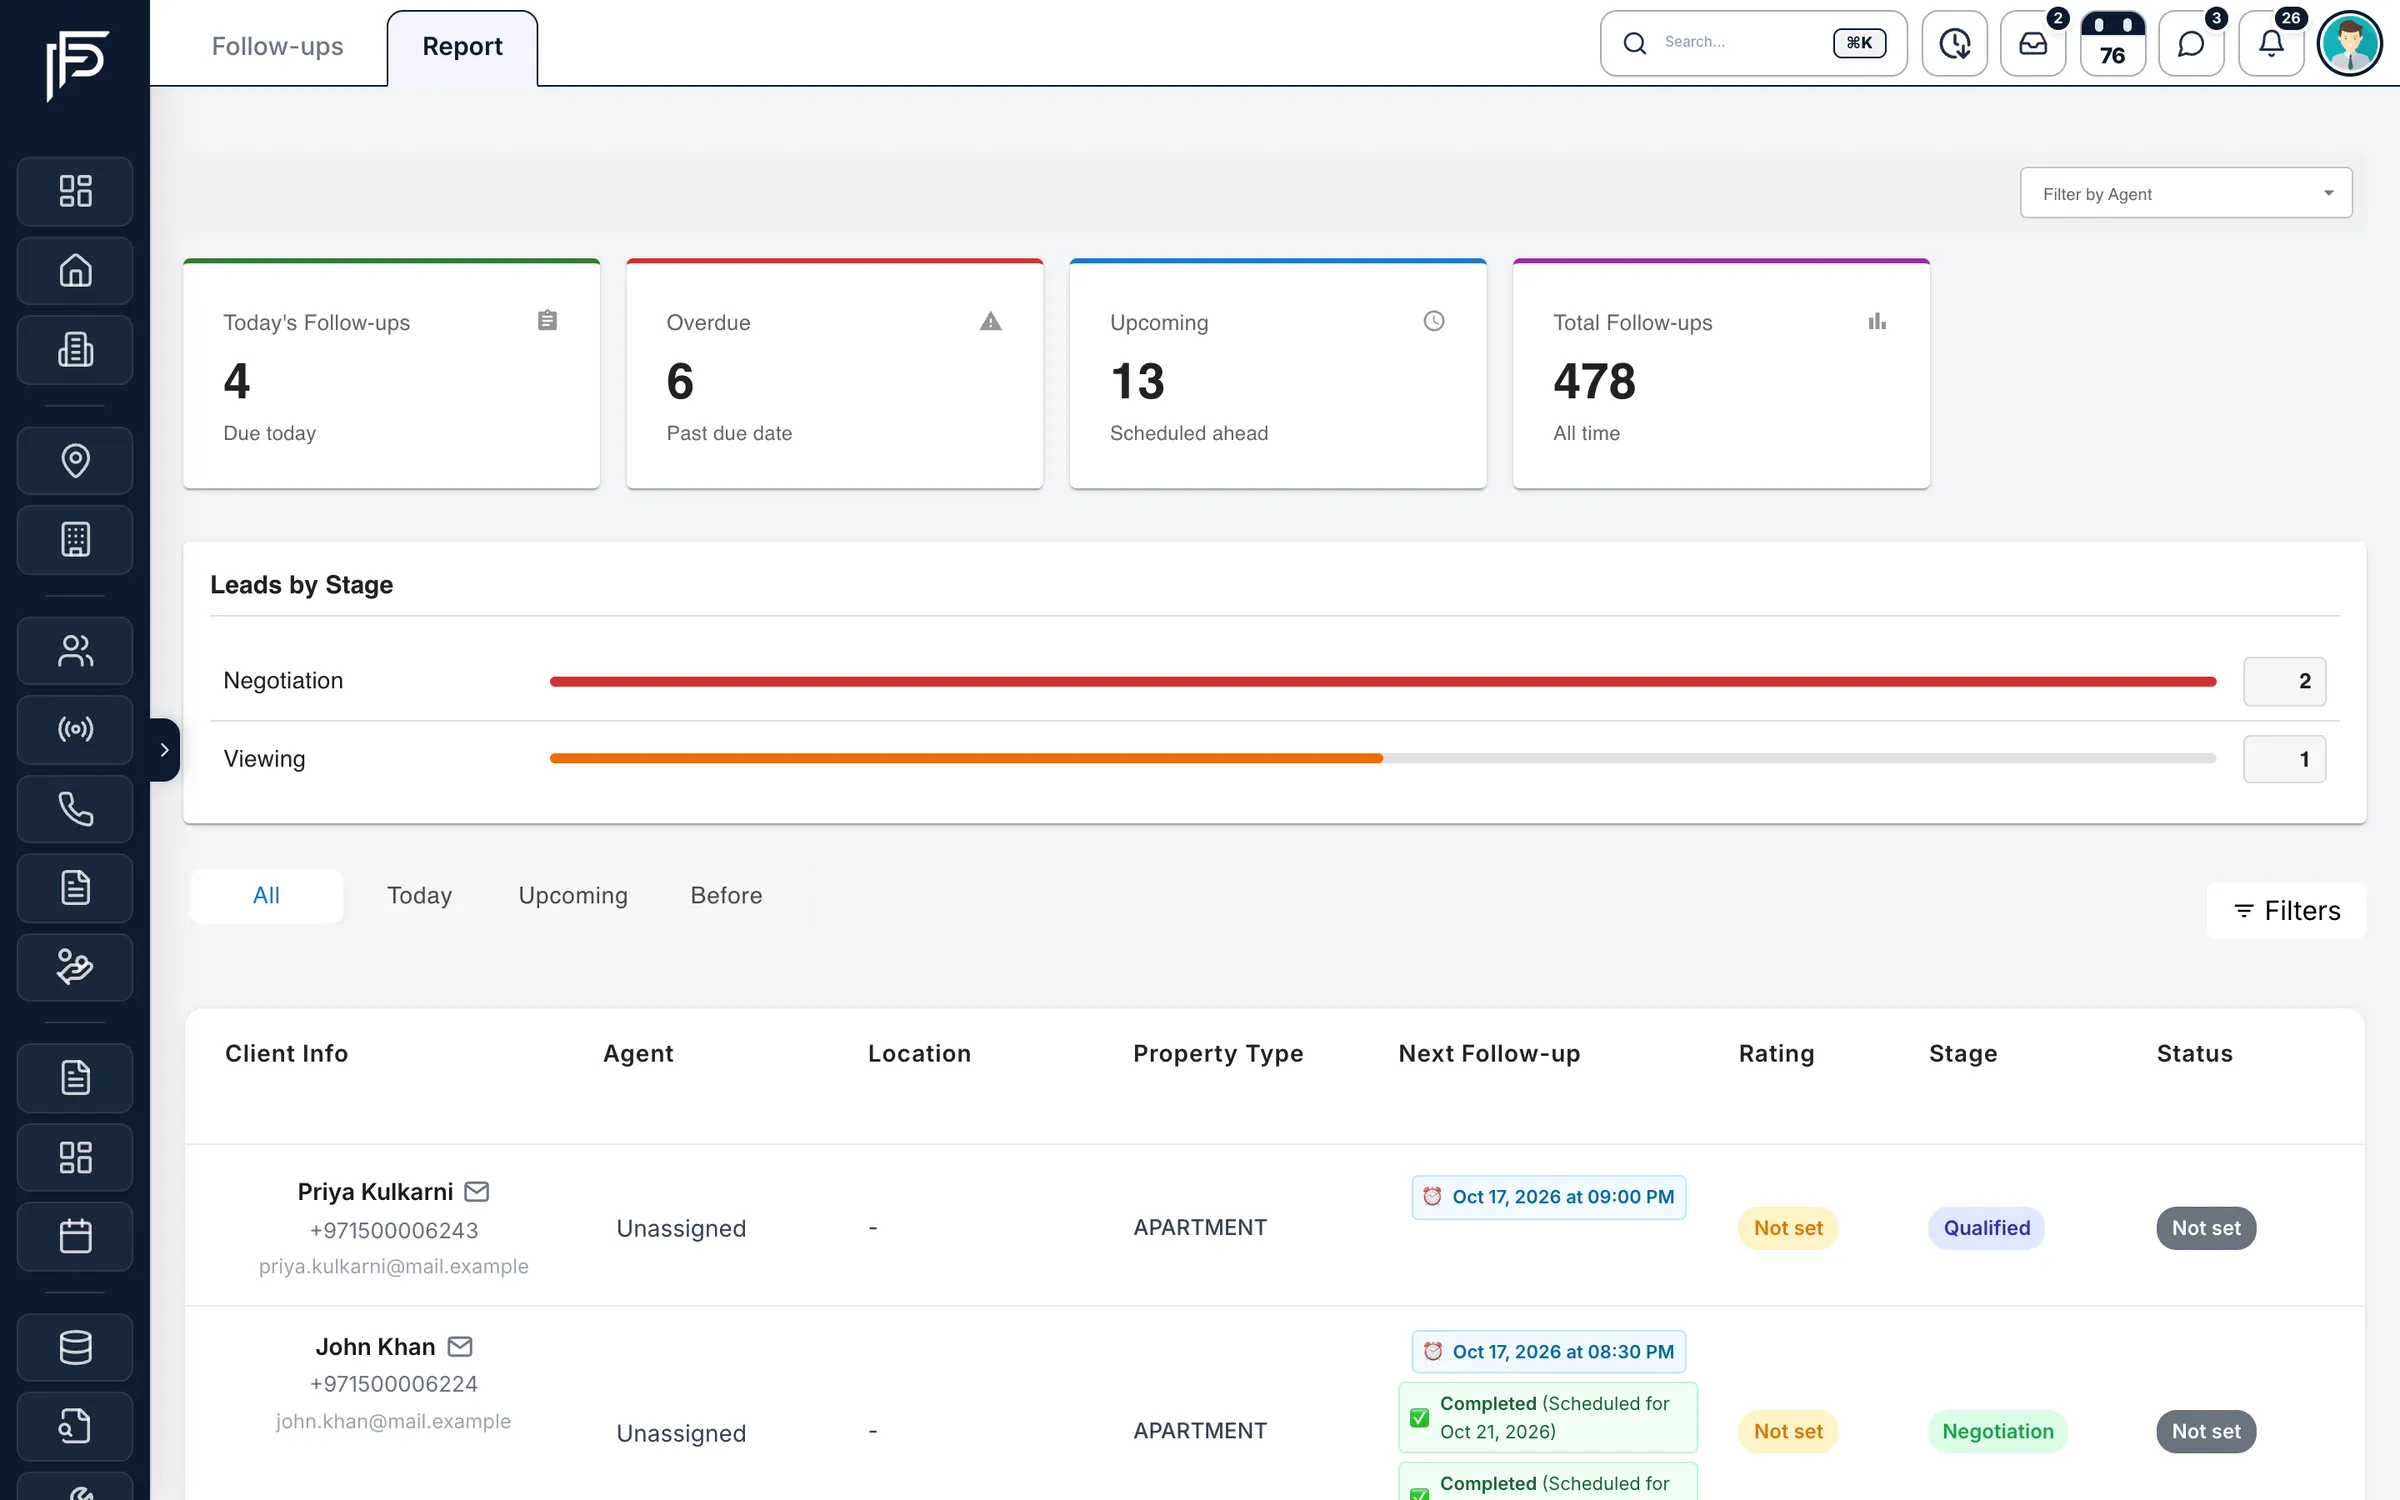
Who is following up, and who is falling behind
- Today, overdue, upcoming and total follow-ups
- Leads by stage, shown as progress bars
- Filter by agent
Staff activity
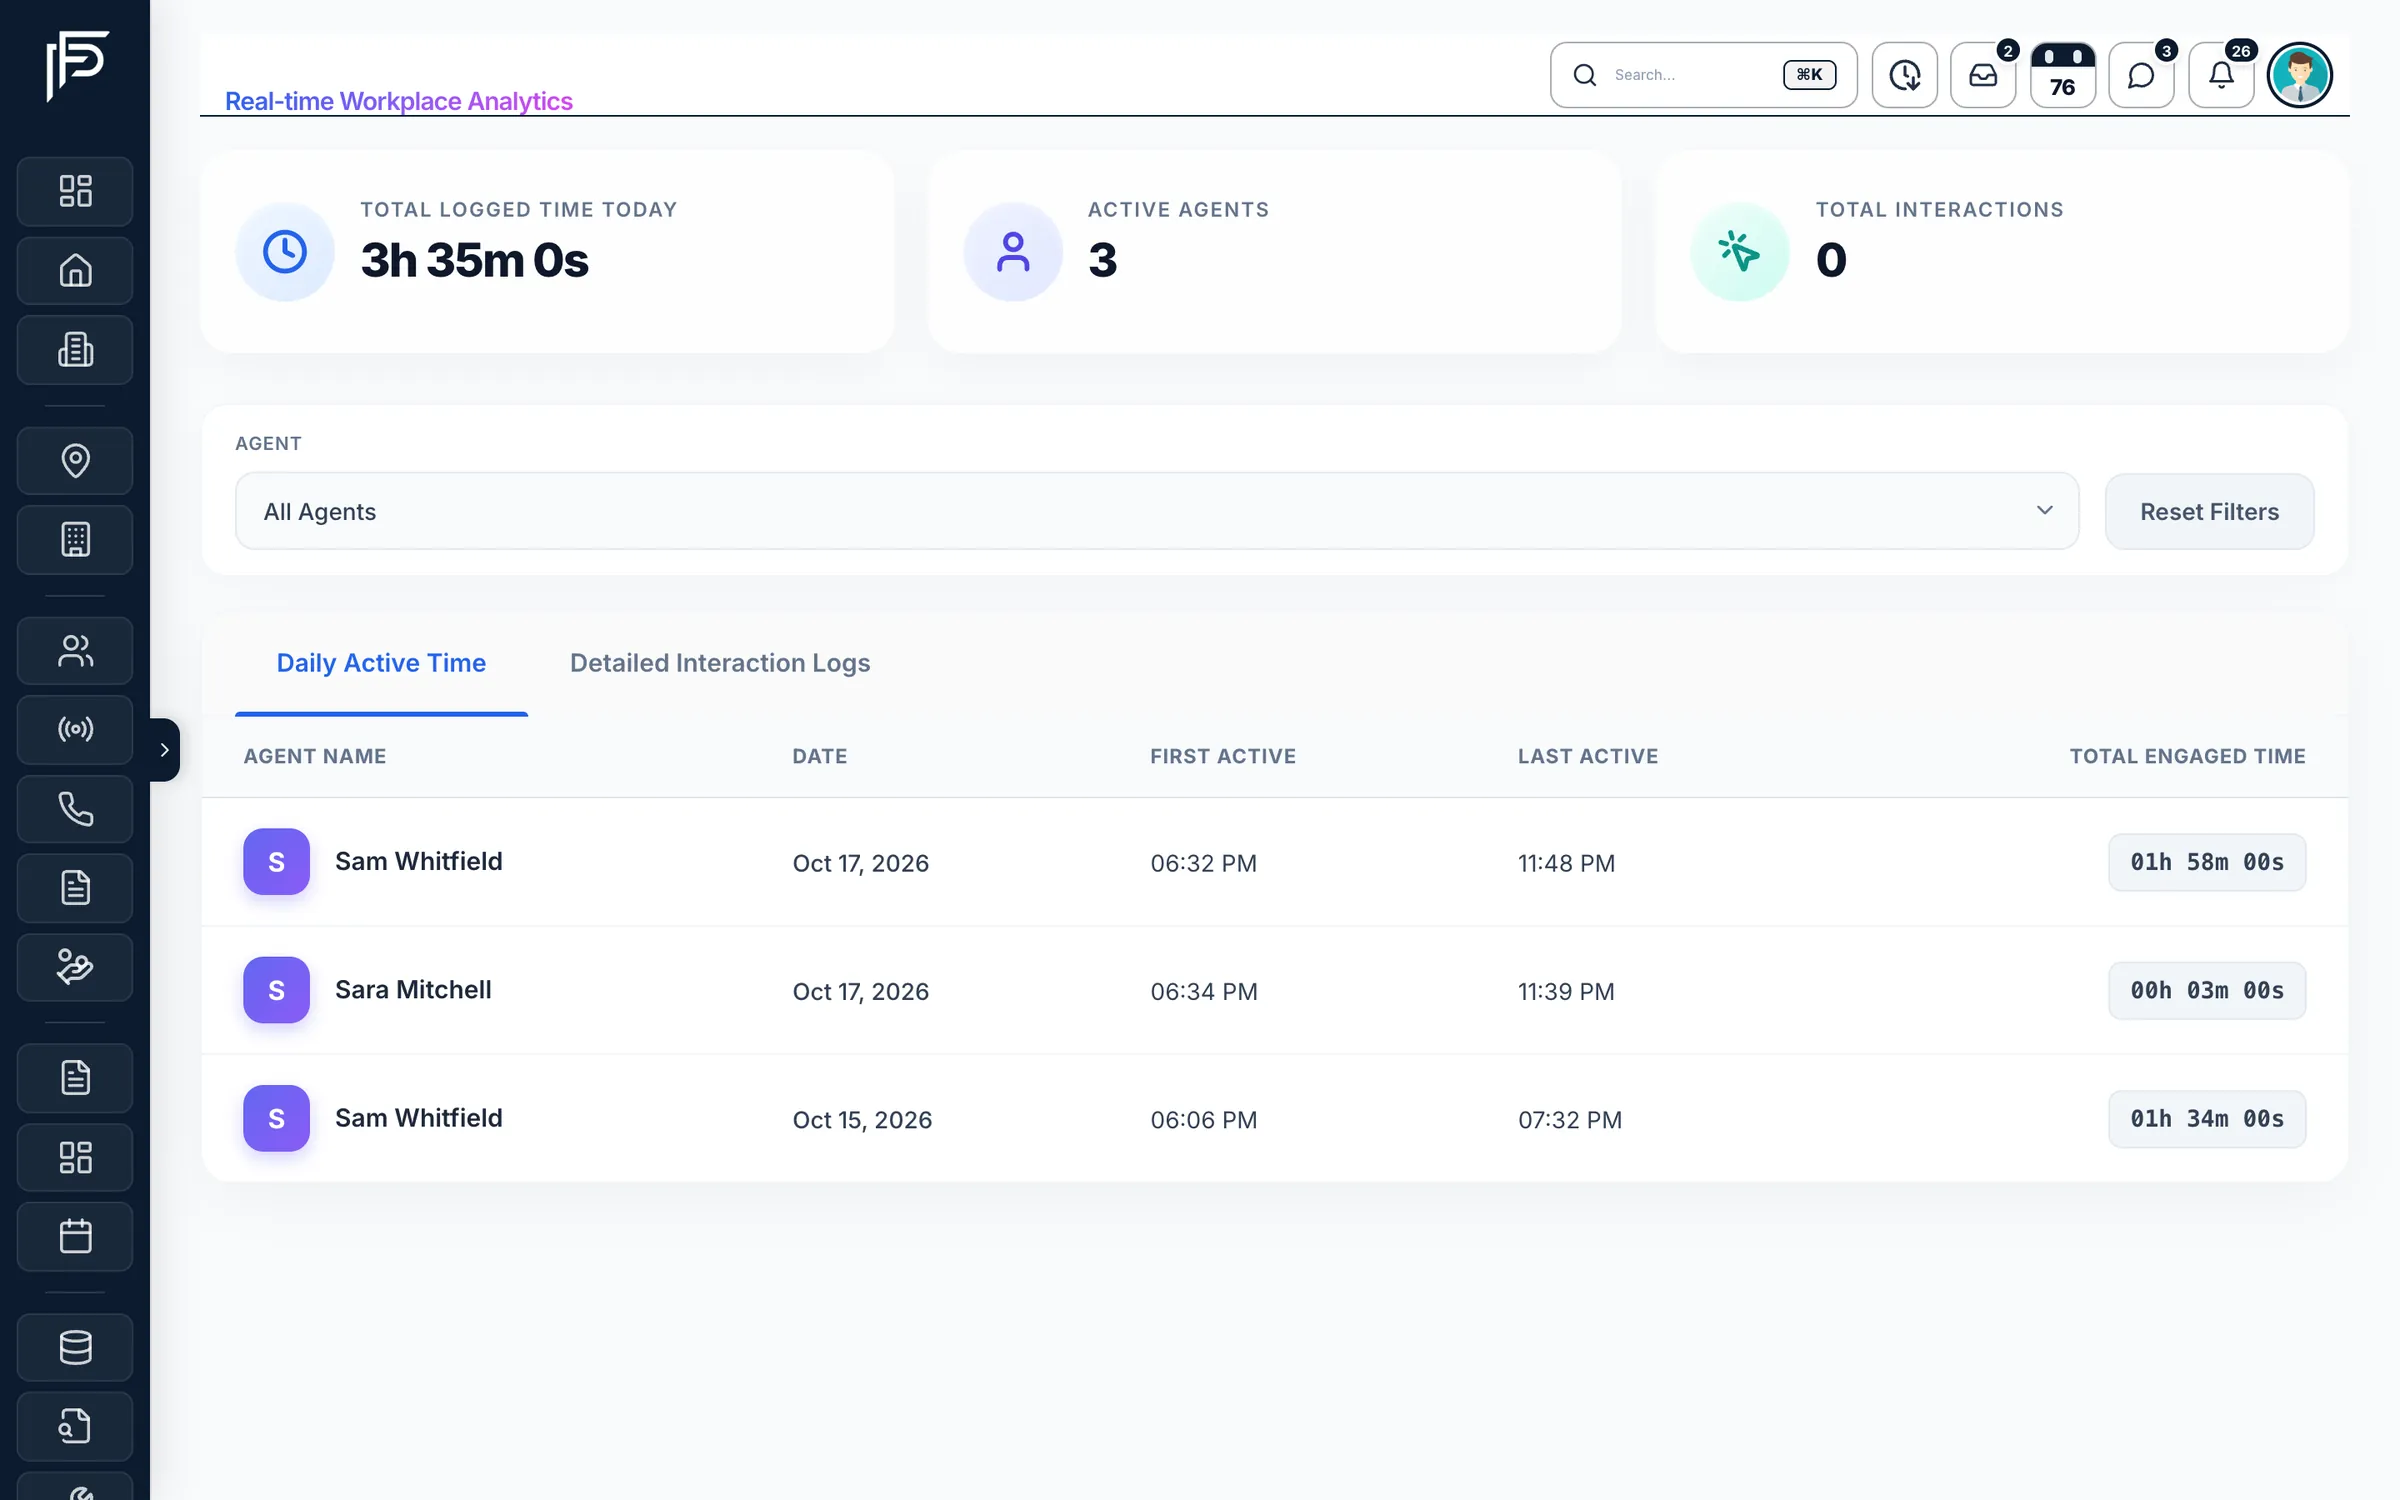
How the team spends its day in the CRM
- Logged time today, active agents and total interactions
- First active, last active and engaged time per agent, per day
- Filter the log by agent, action and module
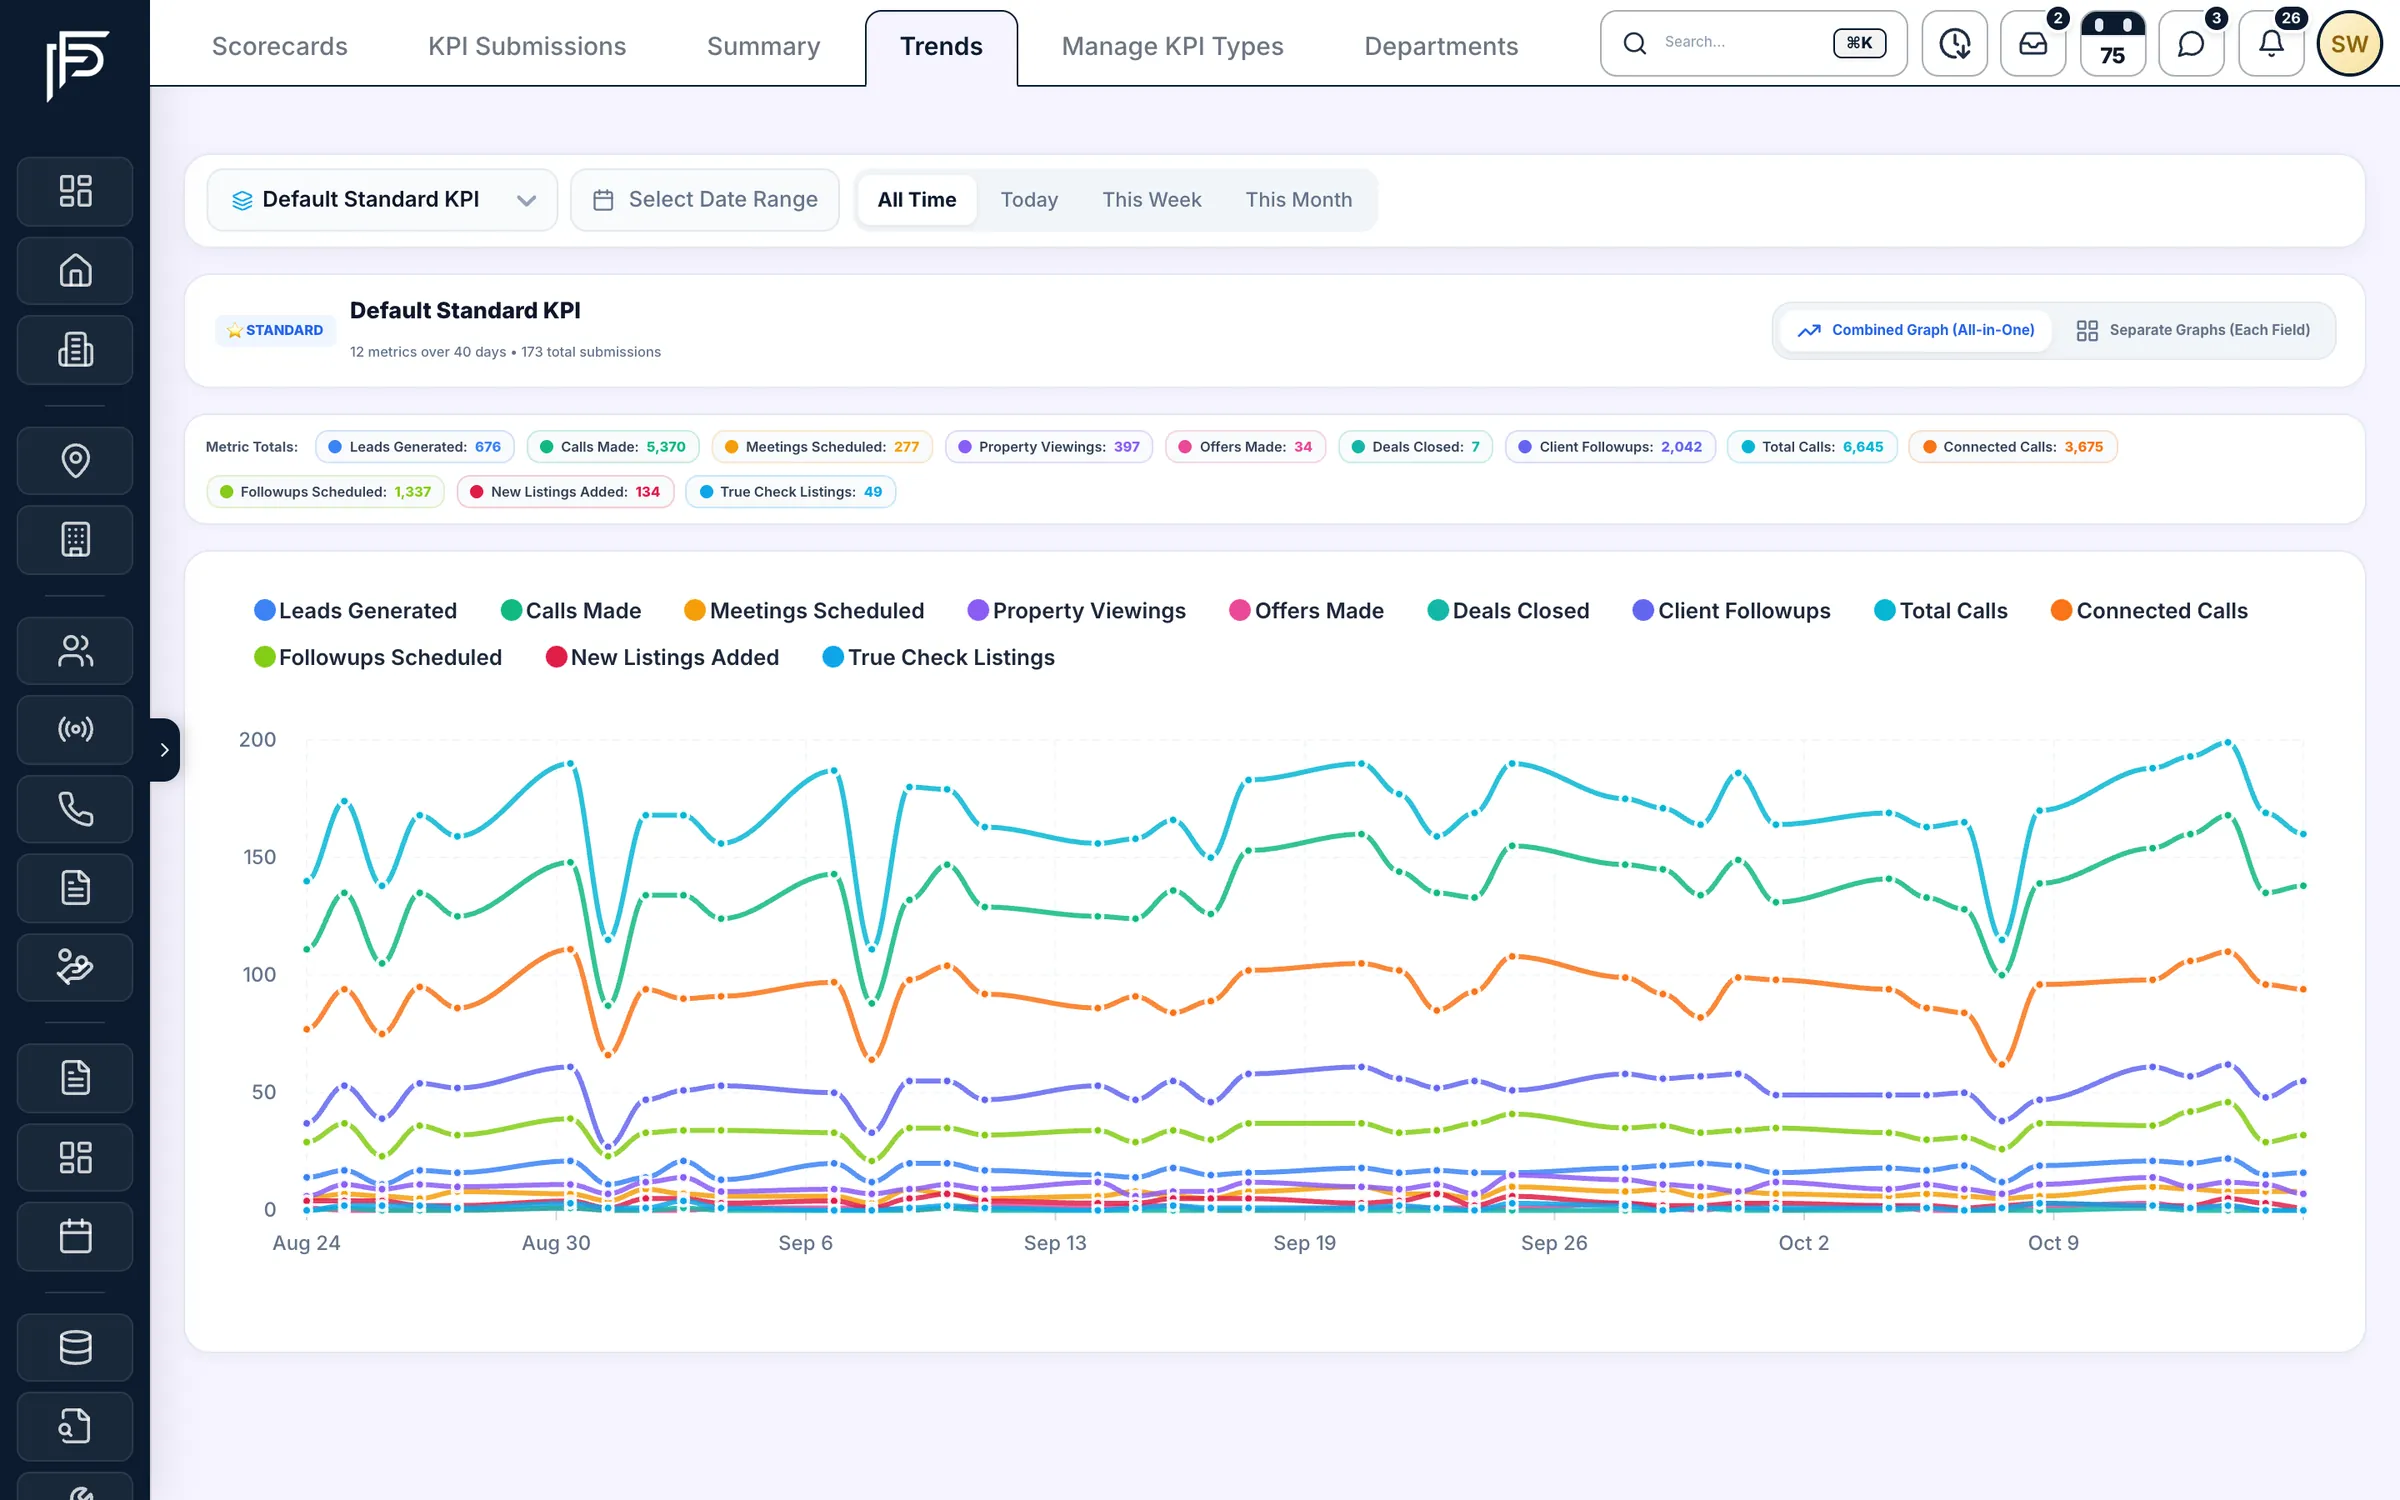
Trends
See the trend before the month ends
- Daily, weekly or monthly intervals
- One combined chart or one chart per field
- For the whole team or one person, on your own KPI template
See more
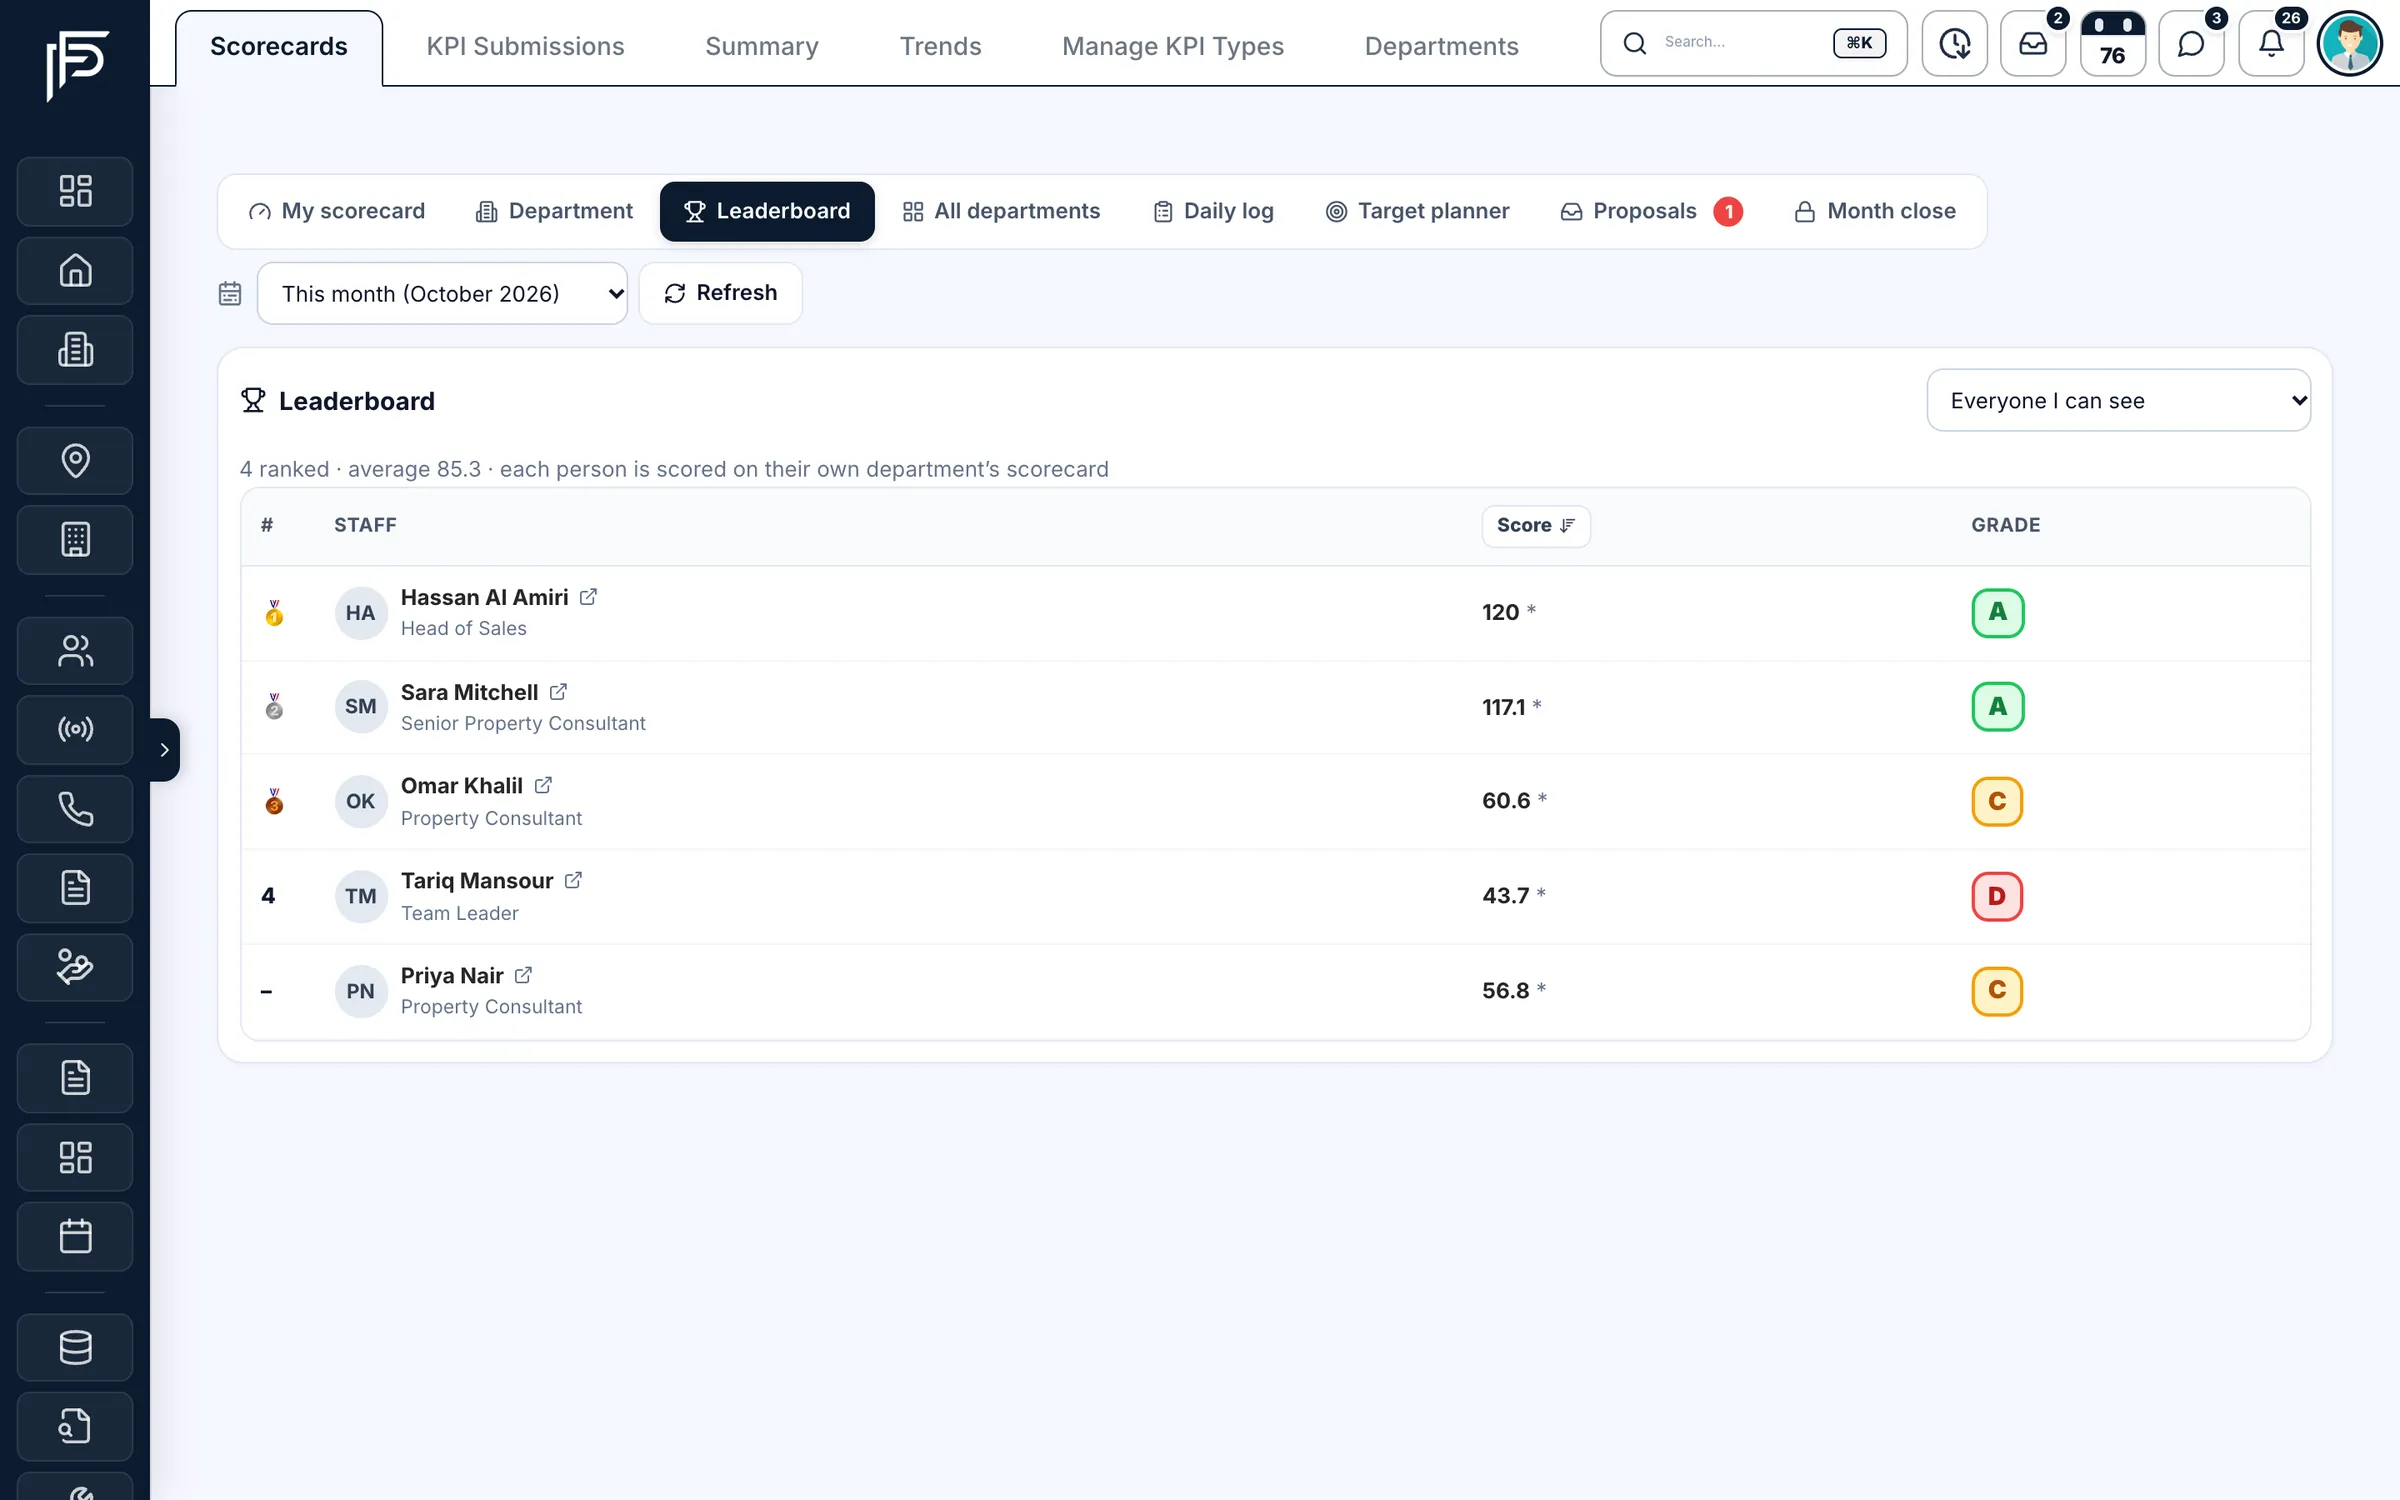
Sales performance, rent collection and renewals
The scorecards your agents are measured on, the cheques your leasing team collects, and the renewals and ID expiries coming up.
Screens show the Propfusion Demo Realty sample workspace. All people, listings and numbers are fictional.
Also included
More reports, ready when you need them
Agent stage report
How many leads each agent moved into every pipeline stage over a period, with totals per stage.
Agent leads and listings
For each agent, total, active and won leads, and active sale and rent listings, over any period.
CSV export
Export the stage report, or the data behind any dashboard chart, as a CSV file.
Quick date ranges
Today, yesterday, last 7 or 30 days, this month, last month or all time.
Rental payment reports
Payment analytics, overdue ageing and the cheque schedule for every tenancy you manage.
Renewals report
Tenancies coming up for renewal, with the new rent, term and status of each draft.
Document expiry report
Tenant and owner Emirates IDs and passports that have expired or will soon.
Data quality flags
Flag a wrong tenant, owner, property or agreement record and track it from open to resolved.
Reports follow permissions
Financial analytics opens only for people allowed to see all transactions; KPI reports need KPI access.
Questions
Analytics and reports questions
- Who can see the financial reports?
- Financial analytics opens only for people allowed to see all transactions, and KPI reports need KPI access. Reports follow the roles and permissions you set for each person.
- Can I export the numbers?
- Yes. Export the agent stage report, or the data behind any dashboard chart, as a CSV file.
- Is the income forecast a prediction?
- No. The income and expense chart adds a three-month projection drawn from the last six months, and says plainly that it is a trend line, not a prediction.
- Can I look at one agent on their own?
- Yes. Filter the follow-up report by agent, see each agent's leads, listings and stage moves over any period, and open staff performance for one person's month: score, targets hit, pace, commission and rank in the team.
- Which date ranges can I pick?
- Today, yesterday, the last 7 or 30 days, this month, last month or all time.
- Are rentals covered too?
- Yes. Rental payment reports, overdue ageing, the cheque schedule, renewals and the document expiry report sit alongside the sales reports.
Works hand in hand with
Run your brokerage on numbers, not guesses
7 days free · No card needed